How to Performance Test LLM Streaming APIs with JMeter: Measuring TTFT and Token Throughput

How to Performance Test LLM Streaming APIs with JMeter: Measuring TTFT and Token Throughput
In this blog post, we will see how to load test a streaming LLM API with Apache JMeter and measure the two numbers that actually matter for a chat-style product: Time to First Token (TTFT) and token throughput. We will spin up a local OpenAI-compatible mock server, write a JSR223 sampler that reads the Server-Sent Events (SSE) stream chunk by chunk, push the custom metrics into JMeter’s own reports, and finish with a quick look at how Feather Wand can review the plan for you.
If you have tried pointing a plain HTTP Request sampler at /v1/chat/completions with "stream": true, you already know the problem. JMeter waits for the connection to close, reports a single elapsed number, and tells you nothing about what the user felt while the answer was still typing itself out. Let us fix that.
AEO Quick Answer: How do you measure TTFT and token throughput in JMeter? Use a JSR223 Sampler (Groovy) instead of the HTTP Request sampler. Open the connection yourself with
HttpURLConnection, read the SSE stream line by line, and callSampleResult.latencyEnd()the moment the firstdata:line arrives. JMeter’s built-in Latency column then becomes TTFT. Count thedelta.contentchunks to get tokens, divide by the generation window to get tokens/second, and expose those values withsample_variablesso they land in the JTL and the HTML report.
Why LLM APIs Need Different Metrics
A REST endpoint either answers or it does not. You measure the round trip, check the status code, and move on. A streaming LLM endpoint behaves more like a person typing.
TTFT (Time to First Token) is the delay between sending the prompt and receiving the first generated token. This is the “is it thinking or is it broken?” moment. Anything above roughly one second starts to feel sluggish in a chat UI, and above three seconds users begin to retry, which makes your load worse.
Token throughput is how many tokens the server produces per second once it has started. Per request, this is what controls the typing speed the user sees. Aggregated across all concurrent users, it is the true capacity number for your inference stack. Requests per second is almost meaningless here: 100 RPS of 20-token replies and 100 RPS of 1,000-token replies are completely different workloads.
Inter-Token Latency (ITL) is the gap between consecutive tokens. A stable 25 ms feels smooth. A jittery stream that pauses for 400 ms every few words feels broken even if the average looks fine.
JMeter ships none of these out of the box. What it does ship is a scripting sampler with full access to the SampleResult object, and that is all we need.
What We Are Building
The final test plan looks like this:
- User Defined Variables for host, port, model, and
max_tokens - CSV Data Set Config feeding realistic prompts
- Thread Group with 10 users, 10 second ramp-up, 5 iterations
- JSR223 Sampler that POSTs to
/v1/chat/completions, reads the SSE stream, and records TTFT, token count, tokens/second, and ITL - Response Assertion on the status code
- JSR223 PostProcessor that appends the metrics to a CSV
- Listeners (View Results Tree, Summary Report, Aggregate Report, Simple Data Writer)
Everything runs against a local mock so you can follow along without an API key or a GPU bill.
Download the Files
If you would rather skip the typing, every file used in this article is available for download:
| File | What it is |
|---|---|
| llm-streaming-ttft.jmx | The complete JMeter test plan (JSR223 sampler, PostProcessor, listeners) |
| llm_stream_sampler.groovy | The streaming sampler script on its own, if you prefer to load it from a file |
| mock_llm_server.py | The OpenAI-compatible SSE mock server (Python standard library only) |
| prompts.csv | Sample prompts for the CSV Data Set Config |
| jmeter-llm.properties | sample_variables plus the Feather Wand settings that point it at the local mock |
Put them all in one directory and run JMeter from that directory. The JMX uses relative paths, so prompts.csv is picked up next to the plan and the metrics land in results/.
Step 1: A Local OpenAI-Compatible Mock Server
You do not want to develop a JMeter script against a paid endpoint. Every failed iteration costs money, and rate limits will skew your numbers before you have even validated the script.
The mock below is plain Python standard library. It exposes GET /v1/models and POST /v1/chat/completions. When stream is true, it sleeps for a “prefill” delay of 250 to 600 ms, then emits one word per data: chunk every 15 to 40 ms in the exact chat.completion.chunk shape the OpenAI SDK produces, and finishes with data: [DONE]. It also adds 5 ms of prefill delay per in-flight request, so TTFT degrades under concurrency the way a real inference server does.
# mock_llm_server.py  (Python 3.10+, no dependencies)import json, random, threading, time, uuidfrom http.server import BaseHTTPRequestHandler, ThreadingHTTPServer
HOST, PORT = "127.0.0.1", 8000WORDS = ("Performance testing validates system behavior under expected and peak load. "         "Latency percentiles like p95 matter more than averages because tail latency "         "defines the user experience.").split()
inflight, lock = 0, threading.Lock()
class Handler(BaseHTTPRequestHandler):    protocol_version = "HTTP/1.1"    def log_message(self, *a): pass
    def _json(self, obj, status=200):        body = json.dumps(obj).encode()        self.send_response(status)        self.send_header("Content-Type", "application/json")        self.send_header("Content-Length", str(len(body)))        self.end_headers(); self.wfile.write(body)
    def do_GET(self):        if self.path.rstrip("/") == "/v1/models":            return self._json({"object": "list", "data": [{"id": "gpt-4o", "object": "model"}]})        self._json({"error": "not found"}, 404)
    def do_POST(self):        global inflight        req = json.loads(self.rfile.read(int(self.headers.get("Content-Length", 0)) or b"{}"))        with lock: inflight += 1; n = inflight        try:            self._stream(req.get("model", "gpt-4o"), n) if req.get("stream") else self._json({                "id": "chatcmpl-" + uuid.uuid4().hex[:24], "object": "chat.completion",                "choices": [{"index": 0, "message": {"role": "assistant",                             "content": " ".join(WORDS)}, "finish_reason": "stop"}],                "usage": {"prompt_tokens": 40, "completion_tokens": len(WORDS),                          "total_tokens": 40 + len(WORDS)}})        finally:            with lock: inflight -= 1
    def _stream(self, model, n):        cid, created = "chatcmpl-" + uuid.uuid4().hex[:24], int(time.time())        self.send_response(200)        self.send_header("Content-Type", "text/event-stream")        self.send_header("Connection", "close")        self.end_headers(); self.close_connection = True        time.sleep(random.uniform(0.25, 0.60) + 0.005 * n)          # prefill / TTFT        for i in range(random.randint(40, 120)):            chunk = {"id": cid, "object": "chat.completion.chunk", "created": created,                     "model": model, "choices": [{"index": 0, "finish_reason": None,                     "delta": {"content": WORDS[i % len(WORDS)] + " "}}]}            self.wfile.write(f"data: {json.dumps(chunk)}\n\n".encode()); self.wfile.flush()            time.sleep(random.uniform(0.015, 0.040))                # inter-token latency        self.wfile.write(b"data: [DONE]\n\n"); self.wfile.flush()
if __name__ == "__main__":    print(f"mock LLM on http://{HOST}:{PORT}")    ThreadingHTTPServer((HOST, PORT), Handler).serve_forever()
Start it with python3 mock_llm_server.py and sanity check it:
curl -N http://127.0.0.1:8000/v1/chat/completions \ -H 'Content-Type: application/json' \ -d '{"model":"gpt-4o","stream":true,"messages":[{"role":"user","content":"hi"}]}'You should see data: lines trickle in one at a time. That trickle is exactly what we need to timestamp.
Two details matter for real endpoints too. First, Connection: close (or proper chunked framing) so the client knows when the body ends. Second, flush after every chunk. If your target sits behind a proxy that buffers SSE, you will measure the proxy, not the model.
Step 2: The Test Plan Skeleton
Create a new test plan and add the following.
User Defined Variables on the Test Plan:
| Name | Value |
|---|---|
LLM_HOST | 127.0.0.1 |
LLM_PORT | 8000 |
MODEL | gpt-4o |
MAX_TOKENS | 256 |
CSV Data Set Config named Prompts CSV, pointing to a prompts.csv with one prompt per line. Set Variable Names to prompt, Ignore first line to False, and Allow quoted data to True. Use prompts of varied length. Prompt length drives prefill time on real models, so a CSV full of “hi” will give you an optimistic TTFT.
Explain the difference between latency and throughput in load testing.What is a good p95 response time target for a web API and why?How do I interpret time to first token for streaming LLM APIs?Write a short summary of how ramp-up time affects JMeter test results.What causes tail latency spikes in distributed systems under load?Compare average versus percentile metrics for capacity planning.How does token throughput relate to user perceived responsiveness?Give three tips for reducing time to first byte in HTTP services.Thread Group named LLM Users: 10 threads, 10 second ramp-up, 5 loops. Start small. A streaming request holds a connection open for two to three seconds even against this mock, and against a real model it can be 30 seconds or more. Ten users is already a meaningful amount of concurrent GPU time.
Step 3: The JSR223 Sampler That Reads the Stream
Add a JSR223 Sampler under the Thread Group, set the language to groovy, and keep Cache compiled script if available checked. Paste the script below.
import groovy.json.JsonOutputimport groovy.json.JsonSlurperimport java.net.HttpURLConnection// Do NOT import org.apache.jmeter.samplers.SampleResult here. The JSR223 sampler// already binds a variable named SampleResult; the import would shadow it.
def host = vars.get("LLM_HOST"); def port = vars.get("LLM_PORT")def body = JsonOutput.toJson([    model: vars.get("MODEL"),    stream: true,    max_tokens: vars.get("MAX_TOKENS") as int,    messages: [[role: "user", content: vars.get("prompt")]]])
SampleResult.setSampleLabel("POST /v1/chat/completions (stream)")def url = new URL("http://${host}:${port}/v1/chat/completions")HttpURLConnection conn = (HttpURLConnection) url.openConnection()conn.setRequestMethod("POST")conn.setDoOutput(true)conn.setConnectTimeout(5000)conn.setReadTimeout(60000)conn.setRequestProperty("Content-Type", "application/json")conn.setRequestProperty("Accept", "text/event-stream")conn.setRequestProperty("Authorization", "Bearer " + (props.getProperty("llm.api.key") ?: "sk-dummy"))
SampleResult.setRequestHeaders(conn.getRequestProperties().toString())SampleResult.setSamplerData(body)
long tSent = System.nanoTime()conn.outputStream.withWriter("UTF-8") { it << body }
int status = conn.responseCodedef slurper = new JsonSlurper()def text = new StringBuilder()int tokens = 0long tFirst = 0L, tPrev = 0Ldef gaps = []
conn.inputStream.withReader("UTF-8") { reader ->    String line    while ((line = reader.readLine()) != null) {        if (!line.startsWith("data:")) continue        def payload = line.substring(5).trim()        if (payload == "[DONE]") break        long now = System.nanoTime()        if (tFirst == 0L) { tFirst = now; SampleResult.latencyEnd() }   // <-- TTFT        def delta = slurper.parseText(payload)?.choices?.getAt(0)?.delta?.content        if (delta) {            tokens++            text << delta            if (tPrev != 0L) gaps << (now - tPrev) / 1_000_000d            tPrev = now        }    }}long tLast = System.nanoTime()
double ttftMs = tFirst ? (tFirst - tSent) / 1_000_000d : -1double totalMs = (tLast - tSent) / 1_000_000ddouble genMs = tFirst ? (tLast - tFirst) / 1_000_000d : 0double tps = genMs > 0 ? tokens / (genMs / 1000d) : 0double itlP50 = gaps ? gaps.sort()[(int) (gaps.size() * 0.5)] : 0
SampleResult.setResponseCode(status.toString())SampleResult.setResponseData(text.toString(), "UTF-8")SampleResult.setResponseHeaders("ttft_ms=${ttftMs.round(1)}\ntokens=${tokens}\ntokens_per_sec=${tps.round(1)}\nitl_p50_ms=${itlP50.round(1)}")SampleResult.setSuccessful(status == 200 && tokens > 0)if (!SampleResult.isSuccessful()) SampleResult.setResponseMessage("HTTP ${status}, tokens=${tokens}")
vars.put("ttft_ms", ttftMs.round(1).toString())vars.put("tokens", tokens.toString())vars.put("tokens_per_sec", tps.round(1).toString())vars.put("itl_p50_ms", itlP50.round(1).toString())vars.put("total_ms", totalMs.round(1).toString())log.info("TTFT=${ttftMs.round(1)}ms tokens=${tokens} tok/s=${tps.round(1)} ITL p50=${itlP50.round(1)}ms total=${totalMs.round(1)}ms")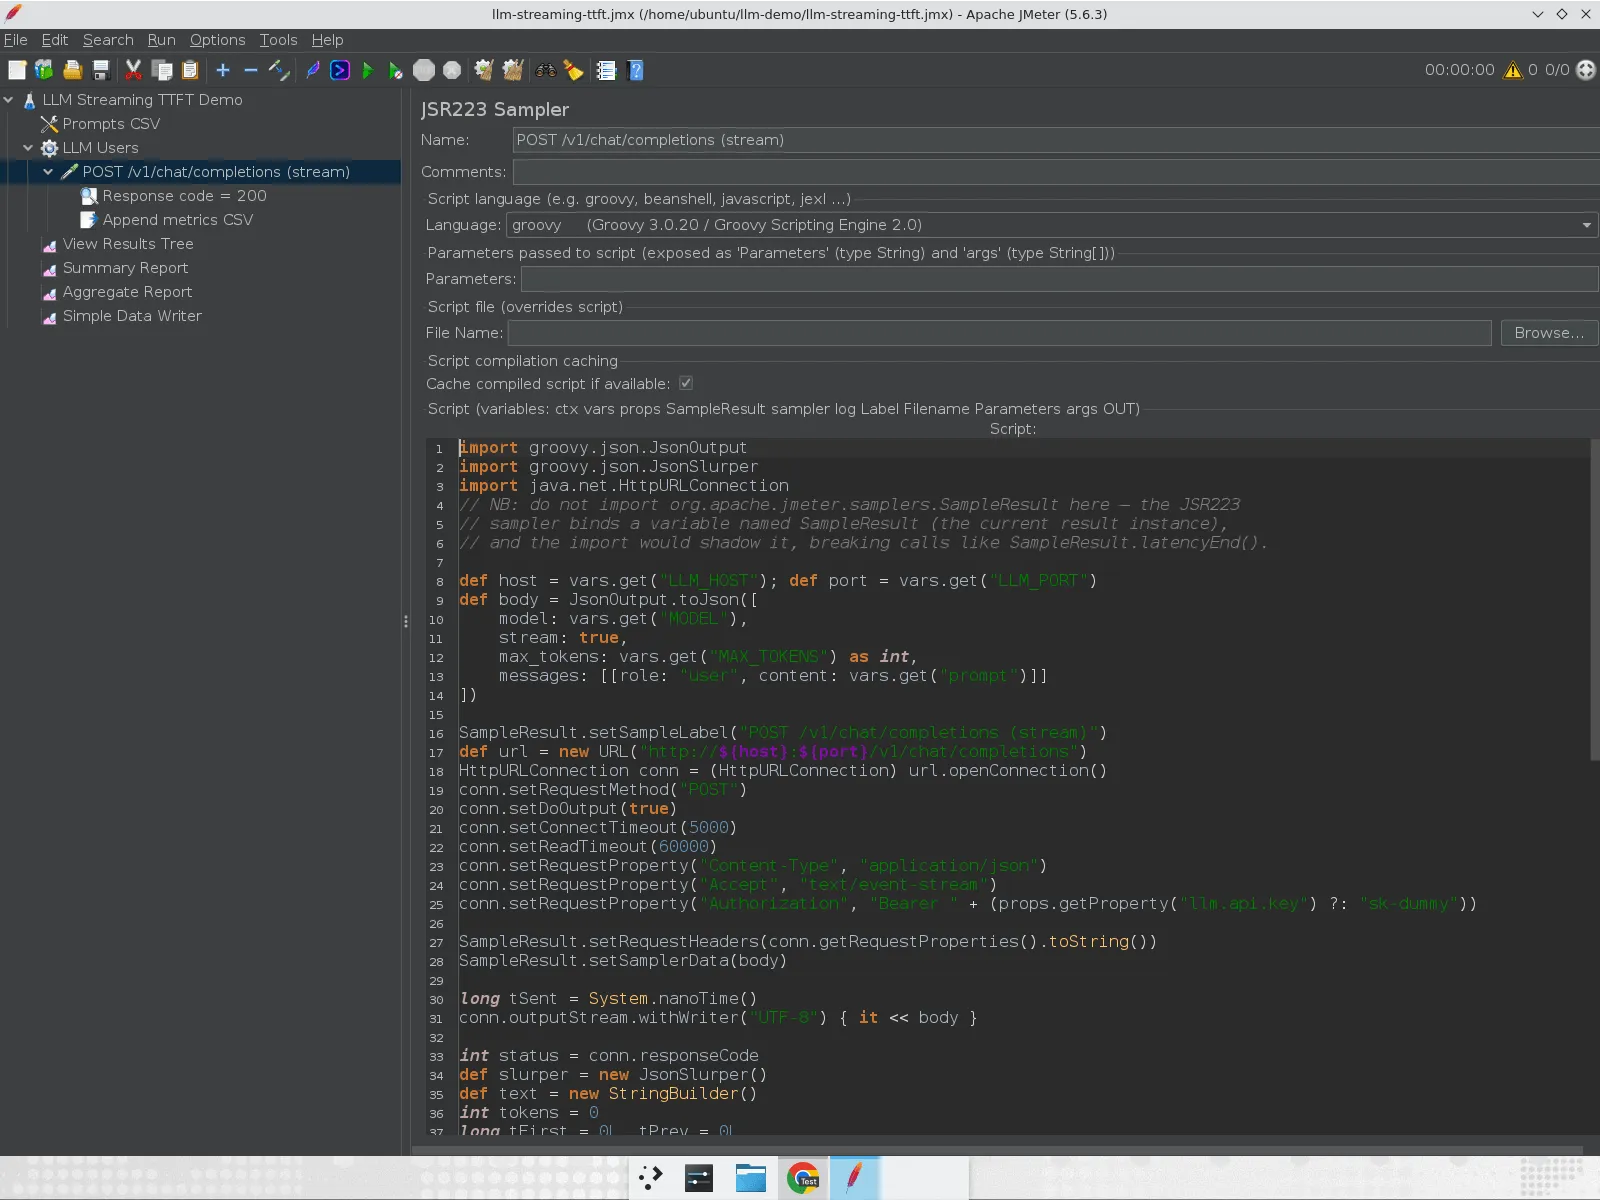
A few things in that script are doing the heavy lifting.
SampleResult.latencyEnd() on the first data: line. JMeter’s Latency column normally means time to first byte for HTTP samplers. In a JSR223 sampler you control when it is stamped. By calling it when the first SSE event arrives, Latency becomes TTFT in every listener, every JTL, and the HTML dashboard, with zero extra configuration.
elapsed stays the full stream duration. JMeter closes the sample when the script returns, so elapsed is request start to [DONE]. That is your end-to-end generation time.
Token counting by delta.content. Each OpenAI-style chunk carries one delta. Counting chunks gives you a close approximation of output tokens. If you need exact numbers, some providers send a final chunk with a usage object when you pass "stream_options": {"include_usage": true}. Parse that instead when it is available.
Tokens per second is measured over the generation window, first token to last token, not over the whole request. Mixing prefill time into the denominator makes short answers look slow and long answers look fast.
Response headers as a metrics scratchpad. Setting ttft_ms, tokens, and tokens_per_sec as response headers is a cheap trick that makes them visible in View Results Tree without adding any more elements.
Add a Response Assertion under the sampler that checks Response Code equals 200. The script already marks the sample failed when no tokens arrive, so the assertion mostly guards against 429s and 5xx responses on real endpoints.
Step 4: Persist the Metrics
JMeter variables vanish at the end of each iteration, so we need to write them somewhere.
Option A: sample_variables. Add this line to user.properties (or pass a dedicated properties file with -q):
sample_variables=ttft_ms,tokens,tokens_per_sec,itl_p50_msEvery JTL written by a Simple Data Writer or the -l flag now gets four extra columns. This is the lowest-effort option and it works with the HTML report generator.
Option B: a JSR223 PostProcessor. If you want a clean CSV for pandas or Excel, add a JSR223 PostProcessor under the sampler:
File f = new File("results/llm-metrics.csv")f.getParentFile().mkdirs()synchronized (f) { if (!f.exists()) { f.append("timestamp,thread,ttft_ms,tokens,tokens_per_sec,itl_p50_ms,total_ms\n") } f.append("${prev.getEndTime()},${prev.getThreadName()},${vars.get('ttft_ms')},${vars.get('tokens')},${vars.get('tokens_per_sec')},${vars.get('itl_p50_ms')},${vars.get('total_ms')}\n")}I use both. The JTL feeds the standard report, the CSV feeds whatever analysis I want to do afterwards.
Finally, add View Results Tree, Summary Report, Aggregate Report, and a Simple Data Writer pointing at results/results.jtl.
Step 5: Run It and Read the Results
Start the mock, then run the plan from the GUI first so you can inspect individual samples.
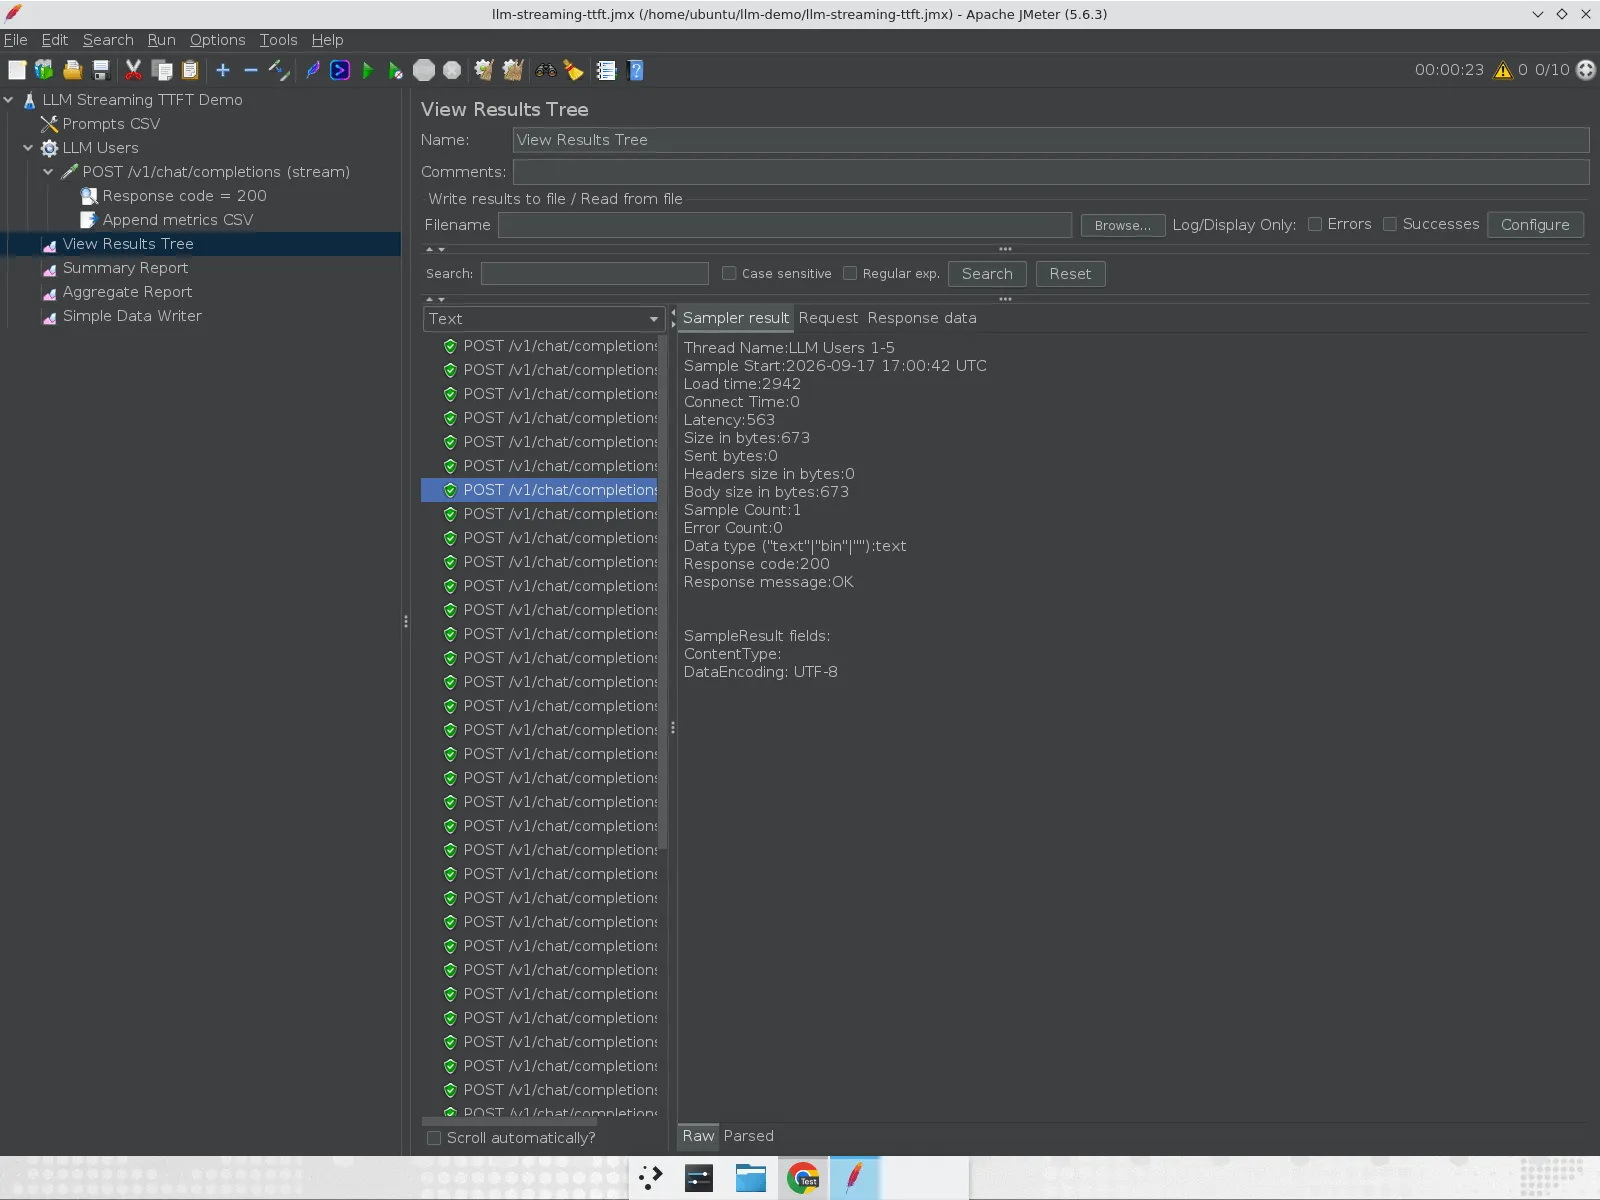
Look at the Sampler result panel. Latency: 563 ms is the TTFT for that request. Load time: 2,829 ms is how long the full answer took to stream. The gap between them is the generation window.
Switch to the Response headers tab and the custom metrics are right there:
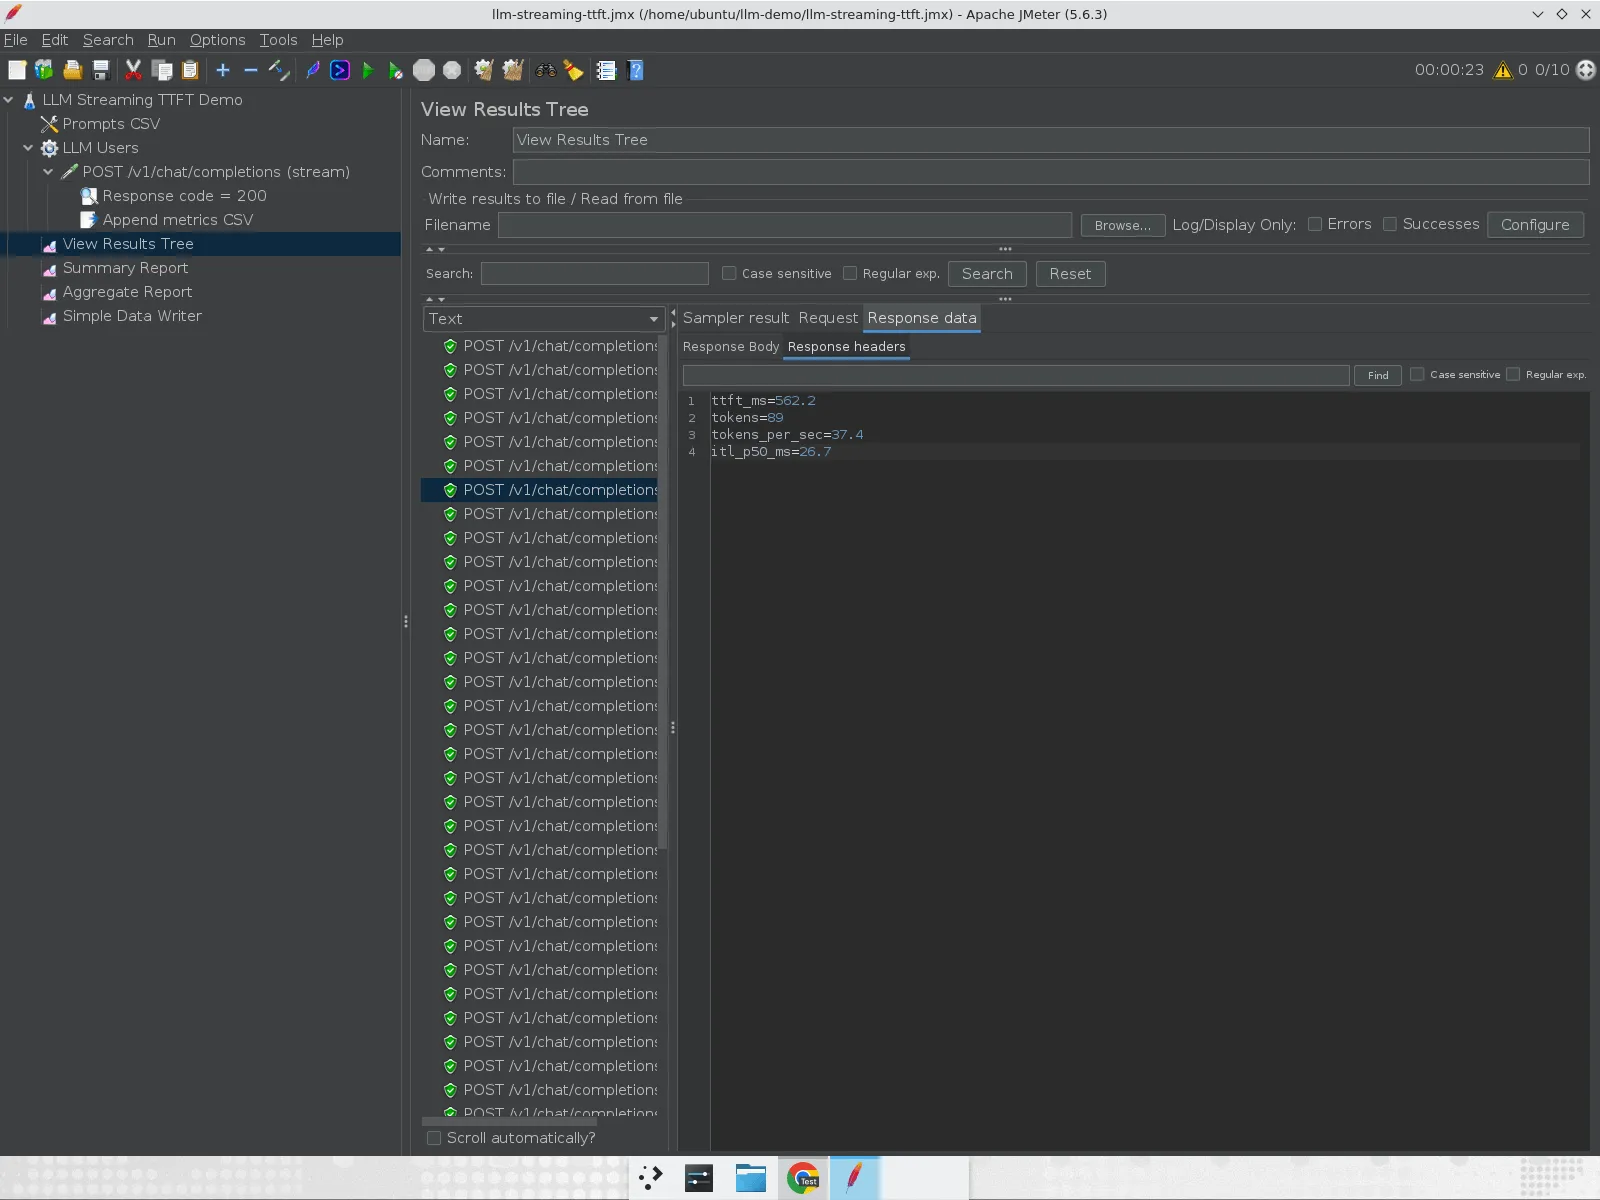
For this sample: 89 tokens streamed at 37.4 tokens/second with a median inter-token gap of 26.7 ms. That is a smooth, readable typing speed.
Now open the Aggregate Report.
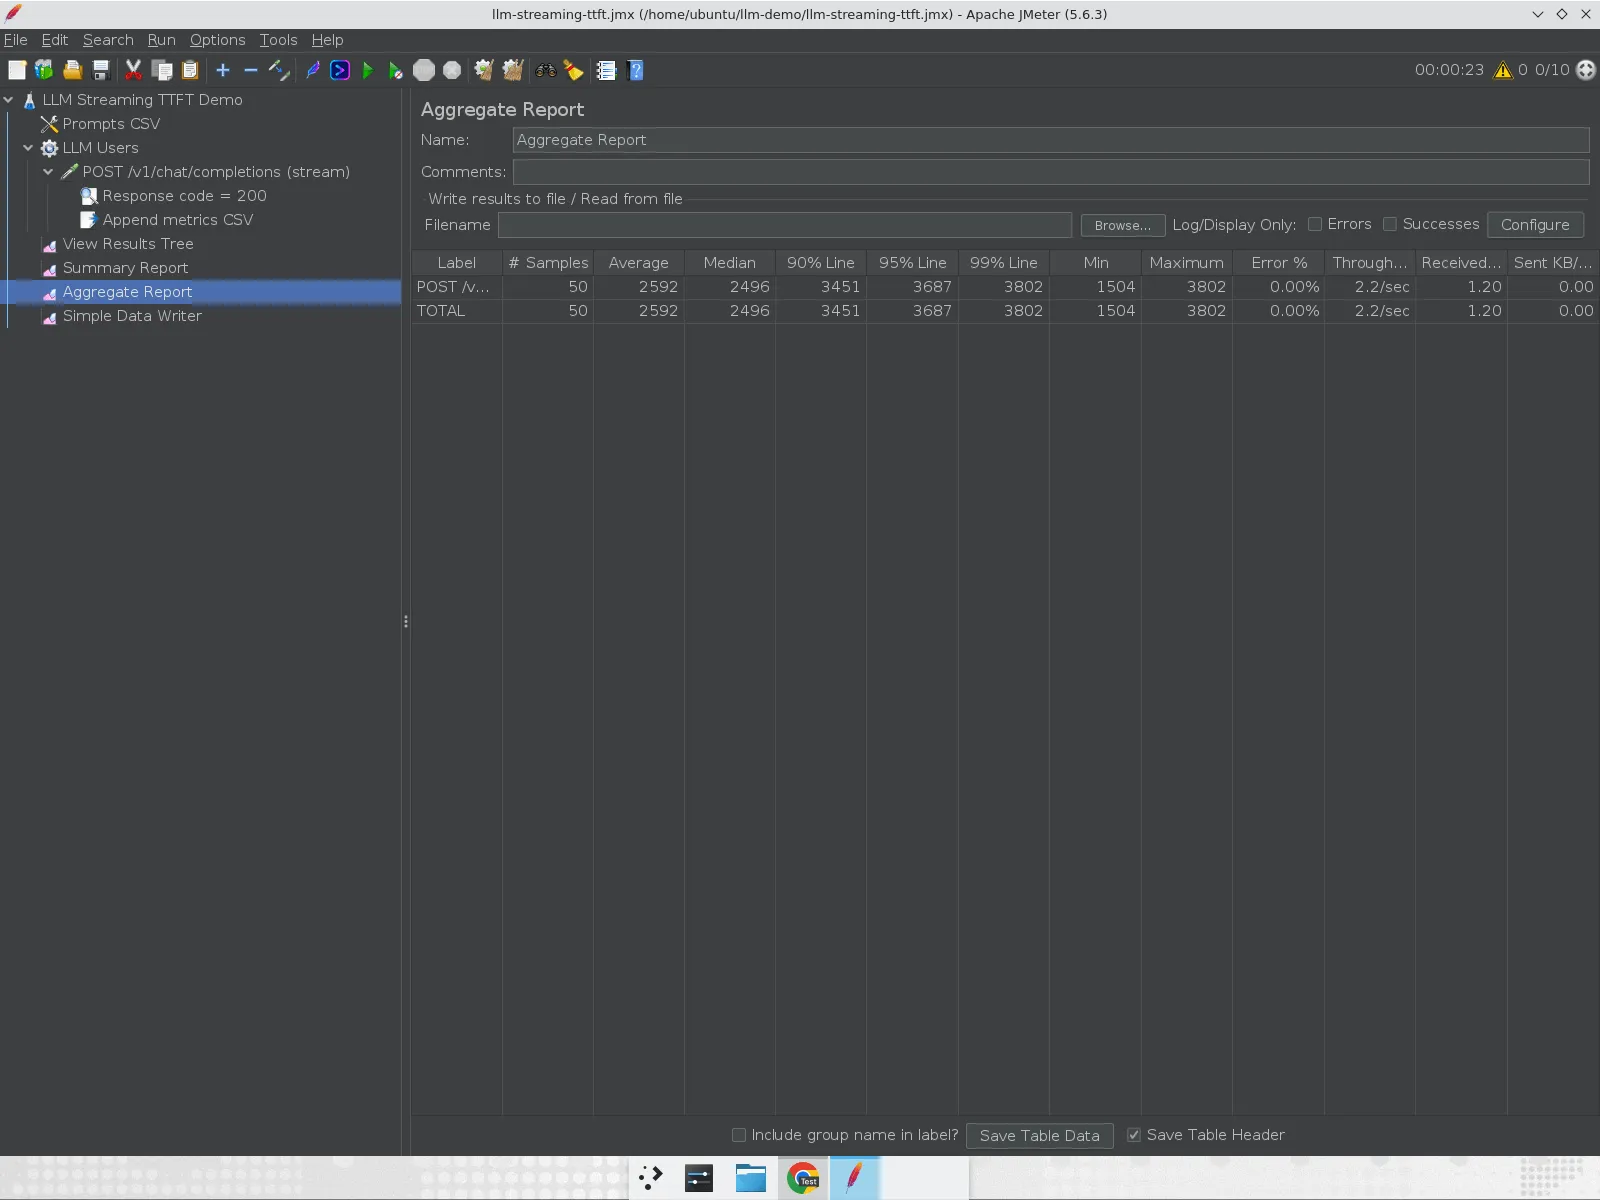
This is where people get misled. The Aggregate Report shows an average of 2.6 seconds and a 95th percentile of 3.7 seconds. If you did not know this was a streaming endpoint, you would file a bug. But the user saw the first word after roughly half a second and then watched the answer type itself out at a comfortable pace. Elapsed time is the wrong headline metric for streaming APIs. Use it to size connection pools and timeouts, not to judge responsiveness.
For the headline numbers, run the plan in non-GUI mode from the directory that holds the JMX and properties file, and generate the HTML report:
jmeter -n -t llm-streaming-ttft.jmx \ -q jmeter-llm.properties \ -l results/results.jtl \ -j results/jmeter.log \ -e -o results/report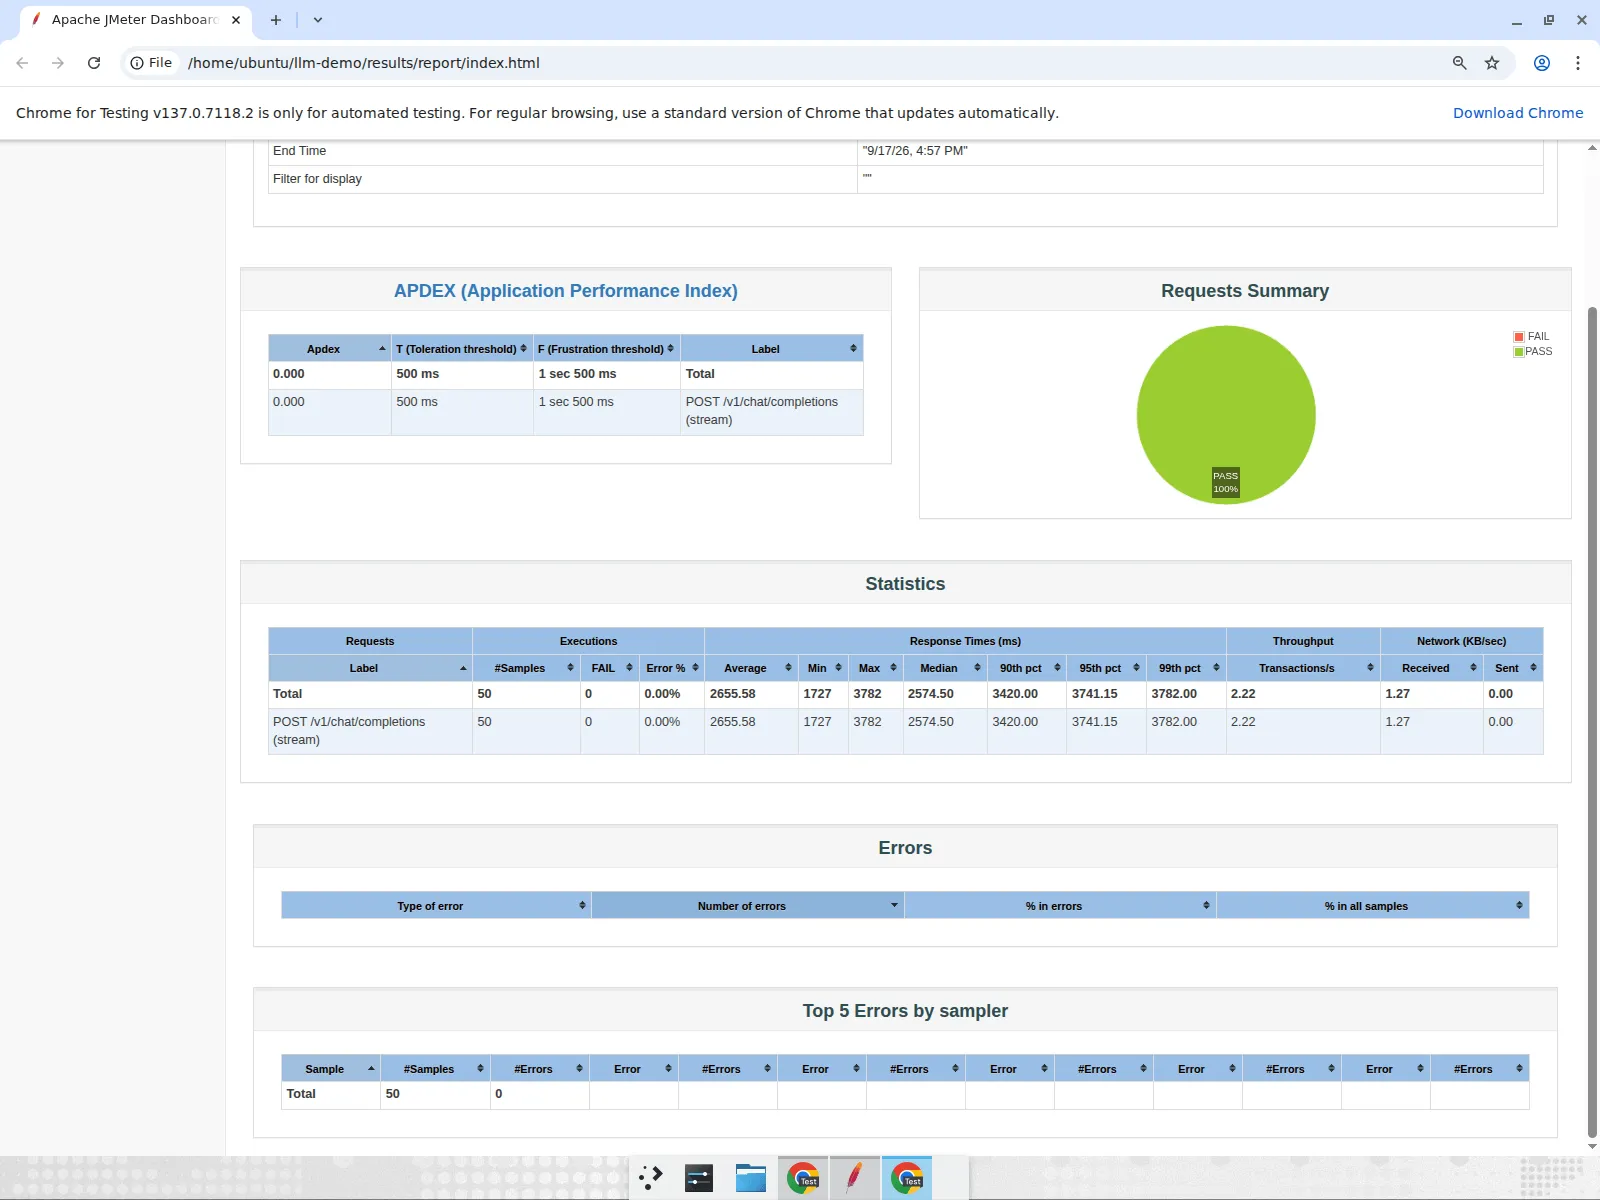
Notice the APDEX of 0.000. The dashboard scores against elapsed with a 500 ms toleration threshold, so every streaming request “fails” even though the test had zero errors. Either raise jmeter.reportgenerator.apdex_satisfied_threshold and apdex_tolerated_threshold in your properties to something like 3,000 and 8,000 ms for streaming samplers, or ignore APDEX and read the Latencies Over Time chart instead, which is now a TTFT-over-time chart.
Here is what the CSV from a 50-sample run against the mock produced:
samples: 50 errors: 0TTFT p50: 463 ms p95: 640 ms min/max: 277/1379 msmean per-request tokens/s: 36.0aggregate tokens/s (total tokens / wall time): 173.4 (3903 tokens in 22.5 s)Two things to notice. The max TTFT of 1,379 ms is the very first sample, which includes Groovy compilation. Always warm up or discard the first iteration. And the difference between per-request tokens/second (36) and aggregate tokens/second (173) is the whole point of load testing an inference API: the first tells you what one user experiences, the second tells you what the server can sustain. Watch how the first one falls as you push the second one up.
Let Feather Wand Review the Plan
Once the plan works, I usually ask Feather Wand, the AI agent that lives inside JMeter, to review it. Open it with Ctrl+Shift+A, select the sampler in the tree, and ask a plain question.
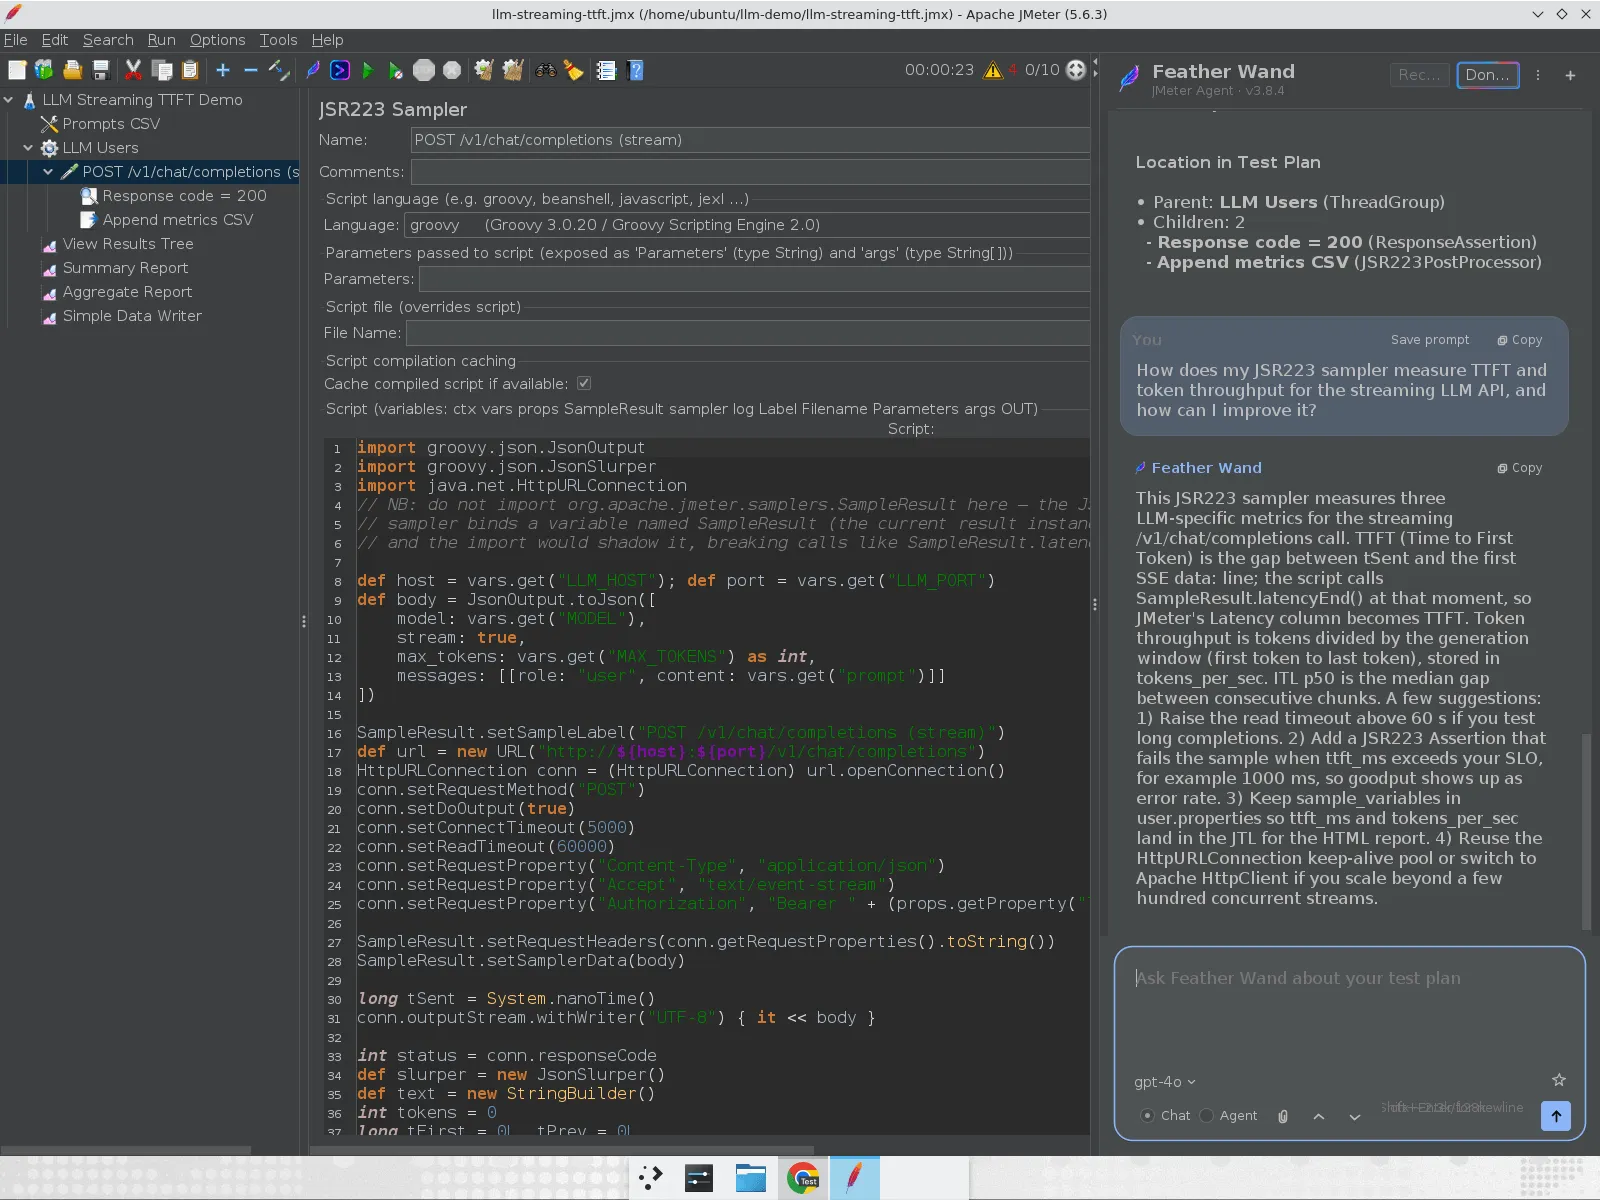
It reads the selected element, explains how the script derives TTFT and tokens/second, and suggests follow-ups such as raising the read timeout for long completions, adding a JSR223 Assertion that fails a sample when ttft_ms breaches your SLO so goodput shows up as error rate, and keeping sample_variables in user.properties so the metrics land in the HTML report. The @this command gives you the element’s XML and its position in the plan without leaving JMeter, and @lint will rename your elements to something more descriptive than “JSR223 Sampler”.
For this article Feather Wand was pointed at the same local mock via openai.base.url, so nothing left the machine. In real use you point it at your own provider or corporate gateway.
Going Further
Fail on TTFT, not just on status code. Add a JSR223 Assertion:
def ttft = vars.get("ttft_ms") as doubleif (ttft > 1000) { AssertionResult.setFailure(true) AssertionResult.setFailureMessage("TTFT ${ttft} ms exceeded 1000 ms SLO")}Now your error rate is a goodput metric: the fraction of requests that met the SLO, not just the fraction that returned HTTP 200.
Vary prompt length deliberately. Prefill cost scales with input tokens. Tag each CSV row with a size column (short, medium, long) and put it in the sample label so the Aggregate Report splits TTFT by prompt class.
Watch the load generator. Each streaming thread holds a socket and a Groovy execution context for the full duration of the response. At 200 concurrent streams, check JMeter’s heap with -Xmx set explicitly, and check that your Latency values are not climbing because the generator is starved. A quick way to tell: run the same plan with 10 threads and 200 threads; if TTFT for the first 10 seconds of the 200-thread run already looks worse, suspect the client.
Reuse connections. HttpURLConnection is fine for a tutorial. For higher concurrency, use Apache HttpClient (already on JMeter’s classpath) with a pooling connection manager so you are not paying a TCP and TLS handshake per request.
Send it to a backend. The stock Backend Listeners aggregate elapsed, not Latency, so TTFT will not reach InfluxDB on its own. Add a small JSR223 Listener that pushes prev.getLatency() and vars.get("tokens_per_sec") to your time-series store if you want TTFT and token throughput on the same Grafana dashboard as your GPU utilization.
Common Gotchas
1. TTFT looks identical to elapsed
Your target is buffering the stream. Check for a reverse proxy with response buffering enabled (proxy_buffering off; in nginx) or a CDN in front of the API. Confirm with curl -N that chunks actually trickle.
2. No signature of method: static ...SampleResult.setSampleLabel()
You imported org.apache.jmeter.samplers.SampleResult at the top of the script. Remove the import. The JSR223 sampler already binds SampleResult as a variable.
3. The first sample is always slow
Groovy compiles the script on first use. Keep Cache compiled script checked and discard the first iteration, or run a one-thread warm-up group before the main Thread Group.
4. Token counts do not match the provider’s bill
Chunk count is not exactly token count. Some providers send multiple tokens per chunk, some send empty deltas for tool calls. Use the final usage object when the API supports it.
5. Read timeout fires on long answers
Sixty seconds is not enough for a 4,000-token completion on a busy model. Raise setReadTimeout or, better, make it a variable and set it per prompt class.
Wrapping Up
JMeter does not know what a token is, and it does not need to. A JSR223 sampler gives you the connection, the stream, and the SampleResult. Stamp latencyEnd() on the first chunk and you have TTFT in every report JMeter can produce. Count the deltas and divide by the generation window and you have token throughput. Everything else is standard JMeter: CSV data, assertions, listeners, backend integrations.
Grab the JMX, scripts, and CSV, run the mock, and look at the gap between Latency and Load time on your first sample. That gap is what your users are actually waiting through, and now you can measure it.
Happy Testing!