How to Test AWS Services Like SQS and Kinesis with JMeter
How to Test AWS Services Like SQS and Kinesis with JMeter
A Practical Guide for Performance Engineers and Backend Developers
Introduction
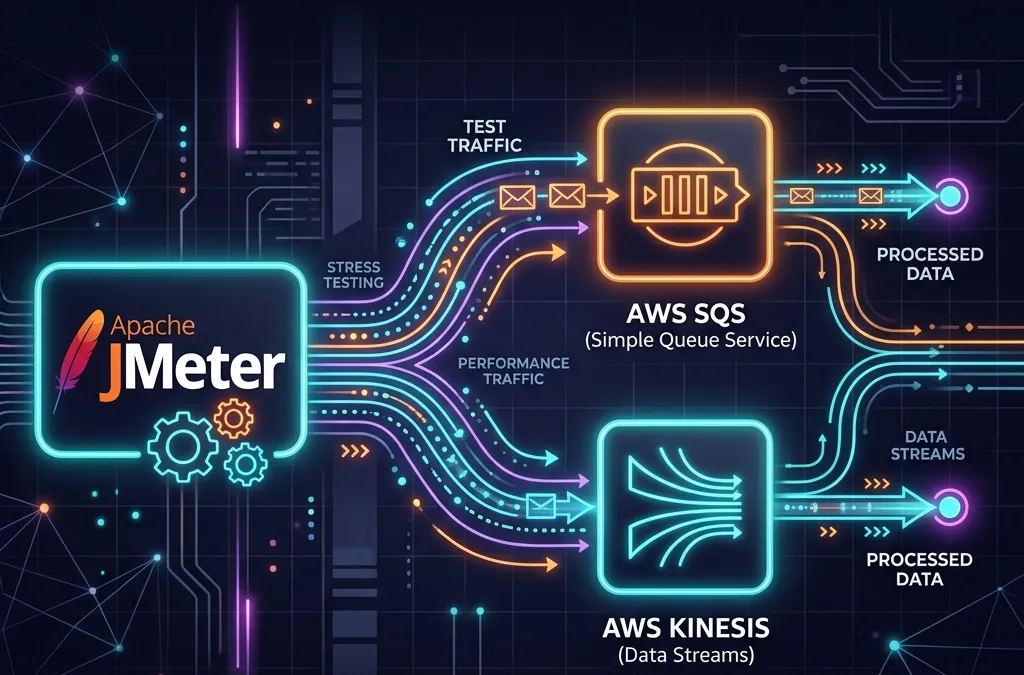
Modern cloud-native applications increasingly rely on managed messaging and streaming services like Amazon SQS (Simple Queue Service) and Amazon Kinesis to handle asynchronous workloads, event-driven architectures, and real-time data pipelines. But how do you ensure these services can handle the load your application demands?
Enter Apache JMeter the open-source, battle-tested performance testing tool that most engineers already know and love. While JMeter is traditionally associated with HTTP load testing, it is fully capable of testing AWS messaging services through the right combination of plugins, SDKs, and configuration.
In this guide, you’ll learn:
- Why testing SQS and Kinesis is important
- How to set up JMeter for AWS service testing
- Step-by-step test plans for SQS and Kinesis
- Best practices for realistic load simulation
- How to interpret your results
Let’s dive in.
AEO Quick Answer: How do you load test AWS SQS and Kinesis using JMeter? To test SQS and Kinesis in JMeter, you can either write custom Groovy scripts using a JSR223 Sampler with the AWS Java SDK JARs placed in JMeter’s
lib/directory, or use a community AWS plugin like JUnit Samplers. You then configure AWS credentials via standard environment variables or local credentials files, build Thread Groups to produce messages, and configure consumers to measure end-to-end processing latency.
Why You Need to Test AWS Messaging Services
Many teams assume that because SQS and Kinesis are managed AWS services, they’ll “just scale.” That assumption can get you into trouble. Here’s why:
1. Throughput Limits Are Real
- SQS Standard queues support nearly unlimited throughput, but FIFO queues are capped at 300 messages/second (or 3,000 with batching).
- Kinesis Data Streams are limited by the number of shards each shard handles 1 MB/sec input and 2 MB/sec output.
Exceeding these limits without proper testing leads to throttling, dropped messages, and degraded application performance in production.
2. Producer and Consumer Imbalance
Your producers might be faster than your consumers. Load testing exposes queue depth buildup, processing lag, and consumer bottlenecks before they become production incidents.
3. Cost Optimization
Testing helps you understand the actual message rates your system generates, which directly impacts your AWS bill. SQS charges per API request; Kinesis charges per shard-hour.
4. End-to-End Latency Validation
Real-time systems built on Kinesis need to meet latency SLAs. Testing validates that your pipeline delivers events within acceptable time windows under load.
Prerequisites
Before you start, make sure you have the following:
- Apache JMeter (version 5.5 or later) https://jmeter.apache.org/
- Java 8 or higher installed on your machine
- AWS CLI configured with appropriate credentials (
aws configure) - An AWS account with access to SQS and Kinesis
- IAM permissions for:
sqs:SendMessage,sqs:ReceiveMessage,sqs:DeleteMessagekinesis:PutRecord,kinesis:PutRecords,kinesis:GetRecords
- AWS Java SDK JARs (or use the JMeter AWS plugin)
Option 1: Using the AWS Java SDK via JMeter’s JSR223 Sampler
The most flexible approach is to write Groovy or Java scripts directly in JMeter using JSR223 Samplers. This gives you full access to the AWS SDK.
Step 1: Add AWS SDK JARs to JMeter
Download the AWS Java SDK v2 (or v1) and place the relevant JARs in JMeter’s lib/ directory:
apache-jmeter/lib/ ├── aws-java-sdk-sqs-x.x.x.jar ├── aws-java-sdk-kinesis-x.x.x.jar ├── aws-java-sdk-core-x.x.x.jar └── (all transitive dependency JARs)Alternatively, use the AWS SDK BOM to download a fat JAR with all dependencies included.
Step 2: Configure AWS Credentials
JMeter will pick up credentials in the standard AWS chain:
- Environment variables (
AWS_ACCESS_KEY_ID,AWS_SECRET_ACCESS_KEY) ~/.aws/credentialsfile- IAM role (if running on EC2)
For local testing, the ~/.aws/credentials file is the simplest approach.
Testing Amazon SQS with JMeter
Creating the Test Plan
1. Add a Thread Group
In JMeter:
- Right-click Test Plan → Add → Threads (Users) → Thread Group
- Configure:
- Number of Threads: 50 (simulating 50 concurrent producers)
- Ramp-Up Period: 30 seconds
- Loop Count: 100
2. Add a JSR223 Sampler for Sending Messages
Right-click Thread Group → Add → Sampler → JSR223 Sampler
Set the language to Groovy and paste the following script:
import software.amazon.awssdk.services.sqs.SqsClientimport software.amazon.awssdk.services.sqs.model.SendMessageRequestimport software.amazon.awssdk.regions.Region
def sqsClient = SqsClient.builder()    .region(Region.US_EAST_1)    .build()
def queueUrl = "https://sqs.us-east-1.amazonaws.com/123456789012/my-test-queue"
def messageBody = """{  "event": "order_placed",  "orderId": "${UUID.randomUUID()}",  "timestamp": "${new Date().format("yyyy-MM-dd'T'HH:mm:ss'Z'")}",  "amount": ${(Math.random() * 500).round(2)}}"""
def request = SendMessageRequest.builder()    .queueUrl(queueUrl)    .messageBody(messageBody)    .build()
def response = sqsClient.sendMessage(request)
SampleResult.setResponseCode("200")SampleResult.setResponseMessage("MessageId: ${response.messageId()}")SampleResult.setSuccessful(true)
sqsClient.close()
💡 Tip: For better performance, initialize the
SqsClientoutside the sampler in a setUp Thread Group and store it as a JMeter variable to avoid creating a new client per iteration.
3. Add a JSR223 Sampler for Receiving Messages
import software.amazon.awssdk.services.sqs.SqsClientimport software.amazon.awssdk.services.sqs.model.ReceiveMessageRequestimport software.amazon.awssdk.services.sqs.model.DeleteMessageRequestimport software.amazon.awssdk.regions.Region
def sqsClient = SqsClient.builder()    .region(Region.US_EAST_1)    .build()
def queueUrl = "https://sqs.us-east-1.amazonaws.com/123456789012/my-test-queue"
def receiveRequest = ReceiveMessageRequest.builder()    .queueUrl(queueUrl)    .maxNumberOfMessages(10)    .waitTimeSeconds(5) // Long polling    .build()
def messages = sqsClient.receiveMessage(receiveRequest).messages()
messages.each { message ->    def deleteRequest = DeleteMessageRequest.builder()        .queueUrl(queueUrl)        .receiptHandle(message.receiptHandle())        .build()    sqsClient.deleteMessage(deleteRequest)}
SampleResult.setResponseCode("200")SampleResult.setResponseMessage("Received and deleted ${messages.size()} messages")SampleResult.setSuccessful(true)
sqsClient.close()
4. Add Listeners
- View Results Tree for debugging
- Summary Report for throughput and latency metrics
- Active Threads Over Time to correlate load with performance
Testing FIFO Queues
FIFO queues require two additional parameters:
def request = SendMessageRequest.builder() .queueUrl(queueUrl) .messageBody(messageBody) .messageGroupId("load-test-group-${Thread.currentThread().getId()}") .messageDeduplicationId("${UUID.randomUUID()}") .build()Remember: FIFO queues have a hard cap of 300 TPS (or 3,000 with batching). Your test should validate behavior at and near this threshold.
Testing Amazon Kinesis with JMeter
Understanding the Kinesis Model
Before testing, understand the key constraints:
- Each shard supports 1,000 records/second or 1 MB/second for writes
- Each PutRecords call can send up to 500 records or 5 MB per request
- Reads are limited to 5 transactions/second per shard
Step 1: Create a Kinesis Stream
Via AWS CLI:
aws kinesis create-stream --stream-name jmeter-test-stream --shard-count 4This creates a stream with 4 shards, supporting up to 4,000 records/second write throughput.
Step 2: JMeter Test Plan for Kinesis Producer
Add a JSR223 Sampler with the following Groovy script:
import software.amazon.awssdk.services.kinesis.KinesisClientimport software.amazon.awssdk.services.kinesis.model.PutRecordsRequestimport software.amazon.awssdk.services.kinesis.model.PutRecordsRequestEntryimport software.amazon.awssdk.core.SdkBytesimport software.amazon.awssdk.regions.Regionimport groovy.json.JsonOutput
def kinesisClient = KinesisClient.builder()    .region(Region.US_EAST_1)    .build()
def streamName = "jmeter-test-stream"
// Build a batch of 100 records per requestdef records = (1..100).collect { i ->    def payload = JsonOutput.toJson([        eventType: "page_view",        userId   : "user-${(Math.random() * 10000).toInteger()}",        sessionId: "${UUID.randomUUID()}",        timestamp: System.currentTimeMillis(),        page     : "/product/${(Math.random() * 1000).toInteger()}"    ])
    PutRecordsRequestEntry.builder()        .data(SdkBytes.fromUtf8String(payload))        .partitionKey("partition-${(Math.random() * 100).toInteger()}")        .build()}
def request = PutRecordsRequest.builder()    .streamName(streamName)    .records(records)    .build()
def response = kinesisClient.putRecords(request)def failedCount = response.failedRecordCount()
SampleResult.setResponseCode("200")SampleResult.setResponseMessage("Sent 100 records. Failed: ${failedCount}")SampleResult.setSuccessful(failedCount == 0)
kinesisClient.close()
Step 3: JMeter Test Plan for Kinesis Consumer
Testing consumers validates your read throughput and latency:
import software.amazon.awssdk.services.kinesis.KinesisClientimport software.amazon.awssdk.services.kinesis.model.*import software.amazon.awssdk.regions.Region
def kinesisClient = KinesisClient.builder()    .region(Region.US_EAST_1)    .build()
def streamName = "jmeter-test-stream"
// Get shard iteratordef shardIteratorRequest = GetShardIteratorRequest.builder()    .streamName(streamName)    .shardId("shardId-000000000000")    .shardIteratorType(ShardIteratorType.LATEST)    .build()
def shardIterator = kinesisClient.getShardIterator(shardIteratorRequest).shardIterator()
// Read recordsdef getRecordsRequest = GetRecordsRequest.builder()    .shardIterator(shardIterator)    .limit(100)    .build()
def response = kinesisClient.getRecords(getRecordsRequest)def records = response.records()
SampleResult.setResponseCode("200")SampleResult.setResponseMessage("Retrieved ${records.size()} records")SampleResult.setSuccessful(true)
kinesisClient.close()
Using the JMeter AWS Plugin (Alternative Approach)
If writing Groovy scripts feels heavy, the JMeter Plugins Manager offers AWS-specific plugins that abstract the SDK calls.
Install the Plugin Manager
- Download
JMeterPlugins-Manager.jarfrom https://jmeter-plugins.org/ - Place it in
lib/ext/ - Restart JMeter
- Go to Options → Plugins Manager
- Search for AWS and install available plugins
Available AWS Samplers
Some community plugins provide:
- SQS Sampler send/receive with simple configuration fields
- Kinesis Sampler put records with configurable batch sizes
These are great for quick tests but offer less flexibility than direct SDK calls.
Advanced Techniques
1. Parameterizing Message Payloads
Use JMeter’s CSV Data Set Config to read test data from a file:
userId,productId,amountuser-001,prod-42,129.99user-002,prod-07,49.99user-003,prod-99,299.00Reference variables in your scripts:
def userId = vars.get("userId")def amount = vars.get("amount")2. Distributed Load Testing
For high-throughput scenarios (millions of messages/minute), run JMeter in distributed mode:
- Set up multiple JMeter server instances on EC2
- Configure
remote_hostsinjmeter.properties - Run from the controller:
jmeter -n -t test.jmx -r
This lets you scale out your load generators while your SQS/Kinesis endpoints stay in the same AWS region minimizing network latency.
3. Monitoring with AWS CloudWatch
While JMeter captures client-side metrics, pair it with CloudWatch to see the AWS-side view:
Key SQS metrics to watch:
NumberOfMessagesSentNumberOfMessagesReceivedApproximateNumberOfMessagesVisible(queue depth)NumberOfMessagesDeleted
Key Kinesis metrics to watch:
IncomingRecordsGetRecords.IteratorAgeMilliseconds(consumer lag)WriteProvisionedThroughputExceededReadProvisionedThroughputExceeded
4. Simulating Backpressure
To test how your consumers handle a backlog:
- Run producer threads at 2x consumer capacity for 5 minutes
- Watch queue depth grow in CloudWatch
- Then scale consumers up and observe drain rate
This simulates real-world traffic spikes and validates your auto-scaling policies.
Common Pitfalls and How to Avoid Them
| Pitfall | Solution |
|---|---|
| Creating a new SDK client per iteration | Initialize client once in setUp Thread Group |
| Not using long polling on SQS | Set waitTimeSeconds(20) to reduce empty receives |
| Ignoring failed records in Kinesis | Check failedRecordCount() and retry failed entries |
| Testing from outside AWS region | Run JMeter instances in the same AWS region for accurate latency |
| Not cleaning up test queues/streams | Use tearDown Thread Group to delete test resources |
| Hardcoding credentials in scripts | Use environment variables or IAM roles |
Interpreting Your Results
After running your tests, focus on these JMeter metrics:
- Throughput (req/sec): Are you hitting your expected message rate?
- 90th/95th/99th Percentile Latency: How slow are the slowest requests?
- Error Rate: Are any calls failing? Check for
ProvisionedThroughputExceededException - Average Response Time: Baseline for normal behavior
Cross-reference with CloudWatch to confirm the AWS service received what JMeter claims it sent. Discrepancies indicate network issues or SDK retry behavior masking failures.
Cleanup
Always clean up after load tests to avoid unexpected AWS charges:
# Delete SQS queueaws sqs delete-queue --queue-url https://sqs.us-east-1.amazonaws.com/123456789012/my-test-queue
# Delete Kinesis streamaws kinesis delete-stream --stream-name jmeter-test-stream
Conclusion
Testing AWS services like SQS and Kinesis with JMeter is not only possible it’s essential for building reliable, scalable cloud applications. By combining JMeter’s powerful load generation with the AWS Java SDK and CloudWatch observability, you can:
- Validate throughput limits before they cause production incidents
- Identify bottlenecks in your producer/consumer pipelines
- Optimize costs by understanding your real message rates
- Build confidence in your auto-scaling policies
The scripts and patterns in this guide give you a solid foundation. Customize the payloads, thread counts, and batch sizes to match your actual workload and always test in a staging environment that mirrors production as closely as possible.
Happy load testing! 🚀