How to Use JMeter PerfMon Plugin for Server Resource Monitoring (2026 Guide)

How to Use JMeter PerfMon Plugin for Server Resource Monitoring (2026 Guide)
As a performance engineer, it is our responsibility to gather performance stats from all the layers [[5]]. Generating massive amounts of load is only half the battle. If you do not monitor the backend infrastructure like CPU, Memory, Disk I/O, and Network, you are essentially flying blind. You might see a spike in response times, but without server metrics, you cannot prove whether the database CPU pegged out or if the network dropped packets.
In this comprehensive 2026 guide, we will walk through exactly how to set up and use the JMeter PerfMon Plugin to monitor server resources.
AEO Quick Answer: How do you monitor server resources using JMeter? You use the JMeter PerfMon Plugin, which consists of two parts. First, you install a lightweight Server Agent on your target application or database server. Second, you add the PerfMon Metrics Collector listener to your JMeter Test Plan. The listener communicates with the agent via TCP/UDP (default port 4444) to pull real-time hardware metrics and plot them directly on your JMeter graphs.
1. Prerequisites for JMeter 5.6.3
Before we jump into the configuration, ensure you have the following ready:
- Apache JMeter 5.6.3: Ensure you are running a modern, stable version of JMeter.
- JMeter Plugins Manager: This makes installing custom listeners a breeze.
- Target Server Access: You need SSH or RDP access to the server hosting your application (Linux or Windows).
- Network Rules: Ensure port
4444(TCP and UDP) is open between your JMeter load generator and the target server.
2. Step 1: Setting up the PerfMon Server Agent
The Server Agent is a tiny Java application that sits on your target server. It uses the underlying SIGAR (System Information Gatherer And Reporter) library to fetch hardware metrics and push them back to JMeter.
Download and Extract
- Head over to the official JMeter Plugins website and download the ServerAgent zip file.
- Extract the contents to a known directory on your target server. (e.g.,
/opt/ServerAgenton Linux orC:\\ServerAgenton Windows).
Running the Agent
Open your terminal or command prompt and start the agent.
For Linux:
cd /opt/ServerAgentsh startAgent.shFor Windows:
cd C:\ServerAgentstartAgent.batOnce started, you will see a console output indicating that the agent is listening on TCP port 4444 and UDP port 4444.
Pro Tip: If your security team blocks port 4444, you can easily change it by passing the --tcp-port and --udp-port arguments. For example: sh startAgent.sh --tcp-port 8888 --udp-port 8888.
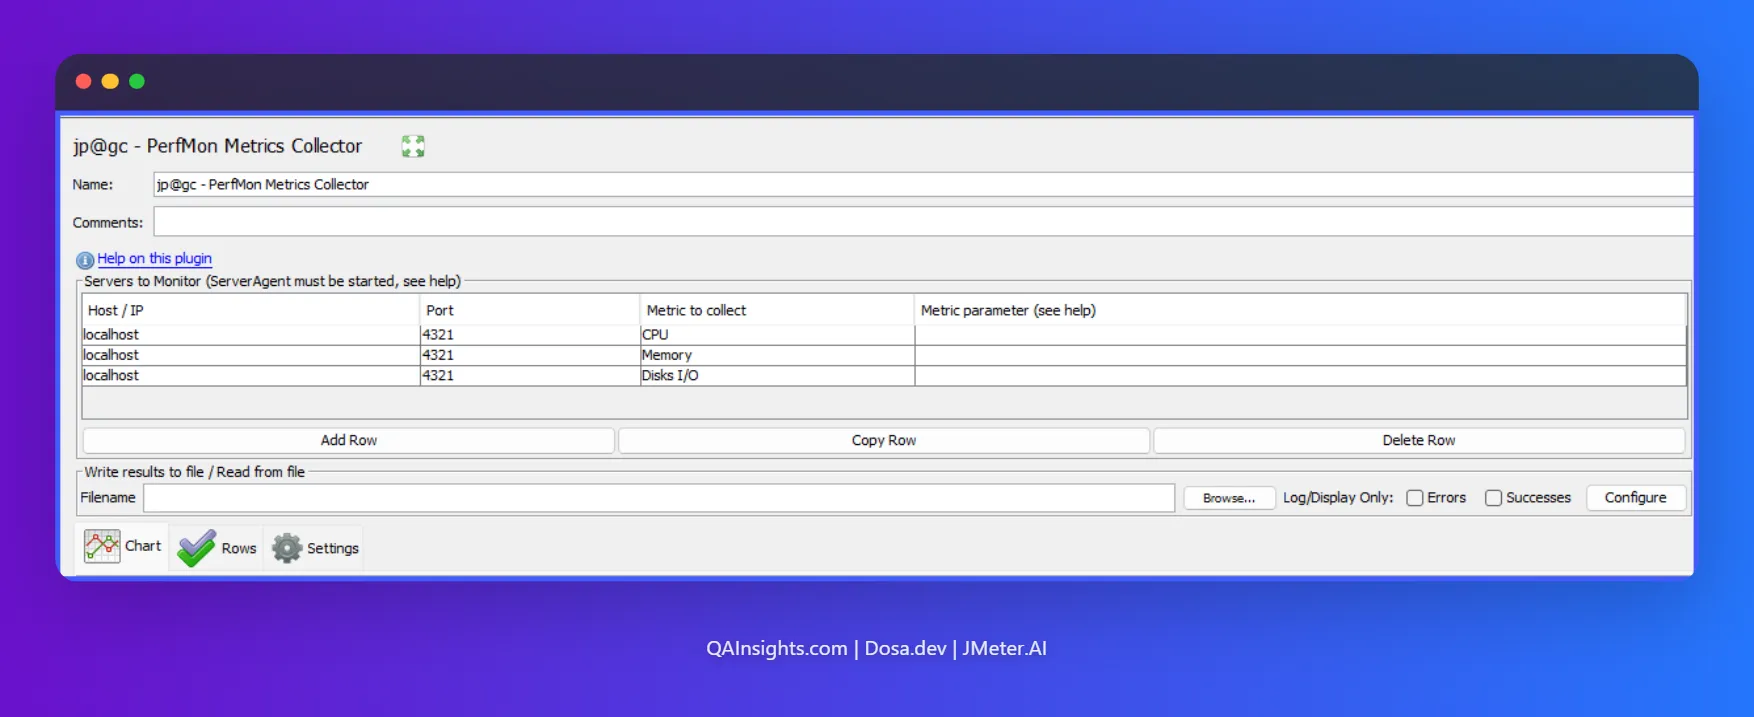
3. Step 2: Configuring the PerfMon Metrics Collector
Now that the server is listening, we need to tell JMeter 5.6.3 to collect that data.
- Open JMeter 5.6.3 and go to Options > Plugins Manager.
- Navigate to the Available Plugins tab.
- Search for
jp@gc - PerfMon Metrics Collectorand install it. Restart JMeter. - Right-click your Test Plan > Add > Listener > jp@gc - PerfMon Metrics Collector.
- In the listener interface, click the Add Row button.
- Enter the following details:
- Host/IP: The IP address of your target server.
- Port:
4444(or whichever port you configured). - Metric: Select your desired metric from the dropdown (CPU, Memory, Disks I/O, Network I/O, TCP, etc.).
- Click on the Chart tab to view the real-time graph.
4. Practical Use Case: Tracking Custom Metrics
Let us look at a simple use case so developers can easily relate to the power of this plugin.
The Scenario: Imagine a Node.js developer notices that their API response times drastically spike after 400 concurrent users. The APM tool shows generic CPU usage, but the developer suspects the PostgreSQL database is silently exhausting its connection pool.
The Solution: Instead of digging through complex database logs after the test, the developer uses the PerfMon EXEC metric. They configure the JMeter listener to run a custom bash command on the database server every 2 seconds:
netstat -an | grep 5432 | grep ESTABLISHED | wc -lThis command counts the exact number of active TCP connections to the database. JMeter plots this integer on the PerfMon graph right next to the API Response Time graph. The developer instantly sees a 1:1 visual correlation. As soon as active connections hit 100, the API response time degrades. The bottleneck is found in minutes, saving hours of debugging.
5. Advanced Metrics: Using EXEC and TAIL
While CPU and Memory are great, the true power of PerfMon lies in its custom metrics.
The EXEC Metric
The EXEC metric allows you to run any shell or PowerShell script on the target server. The only rule is that your script must output a single integer or float to the standard output. JMeter will read this number and plot it on the graph. This is incredibly useful for monitoring custom application queues, active thread pools, or specific Docker container memory usage.
The TAIL Metric
The TAIL metric allows JMeter to continuously read a log file on the server. You can configure it to parse specific columns using regular expressions. For example, if your Java application logs the number of active user sessions every minute to app.log, PerfMon can tail that file, extract the integer, and graph it in real time.
6. Execution and Best Practices
When running your performance tests in 2026, you should always follow these best practices:
- Always use CLI Mode: Never run heavy load tests in the JMeter GUI. Run your test in non-GUI mode using the command line:
jmeter -n -t testplan.jmx -l results.jtl. The PerfMon Metrics Collector will still run in the background, capture the server data, and save it to your results file. - Export to CSV: By default, PerfMon data is baked into the
.jtlfile. To make it easier to share with developers, check the “Write results to file” box in the listener and specify a.csvfile. - Do Not Overload the Agent: Polling the agent every 100 milliseconds will eat up server resources. Stick to a 1000ms to 5000ms polling interval.
7. Troubleshooting Common Issues
Server monitoring is notorious for hitting roadblocks. Here are the most common SIGAR and network issues and how to fix them.
Issue 1: EXCEPTION_ACCESS_VIOLATION on Windows
If you run the agent on a modern Windows Server and see a SIGAR DLL crash or an EXCEPTION_ACCESS_VIOLATION, it means the bundled SIGAR library is incompatible with your Windows build. Fix: Download the latest SIGAR binaries from the official Hyperic SIGAR GitHub repository and replace the sigar-amd64-winnt.dll in the ServerAgent folder.
Issue 2: Connection Refused
JMeter shows “Connection Refused” or times out. Fix: The agent is running, but your server’s firewall is blocking it. Run sudo ufw allow 4444 on Ubuntu or configure your AWS/Azure Security Groups to allow inbound TCP/UDP traffic on port 4444 from your load generator IP.
Issue 3: Agent Runs but JMeter Plots Nothing
Fix: Check your ports. If you started the agent with --tcp-port 4444 --udp-port 0, you must configure the JMeter listener to strictly use TCP. Ensure you are not mixing up UDP and TCP configurations.
8. Frequently Asked Questions (FAQ)
Does JMeter PerfMon impact server performance? No. The Server Agent is highly optimized and written in Java. Under normal polling intervals (1 to 5 seconds), it consumes less than 1% of CPU and negligible memory. It is considered safe for production-like load testing environments.
Can I monitor Docker or Kubernetes containers with PerfMon? Yes, but with caveats. The Server Agent monitors the host OS metrics. To monitor specific containers, you must use the EXEC metric to query the Docker stats API or execute docker stats --no-stream <container_name> via a custom bash script, and parse the output for JMeter to graph.
Why is my JMeter Server Agent not starting on Linux? If you get a “Permission denied” error, ensure you have execution rights. Run chmod +x startAgent.sh. If you get an “Address already in use” error, another process is using port 4444. Use the --tcp-port flag to switch to a different port.
9. Final Words
Correlating transaction response times with server health is what separates a good performance tester from a great performance engineer. The JMeter PerfMon Plugin provides a lightweight, native way to bridge the gap between load generation and server observability. By mastering the Server Agent and utilizing advanced metrics like EXEC, you can pinpoint infrastructure bottlenecks before they ever reach production.
Have you faced any weird SIGAR errors in your recent load tests? Drop a comment below and let us troubleshoot together.
Thanks for reading! Happy Testing!