JMeter Datadog Backend Listener: Stream Test Results to Datadog in CI/CD

JMeter Datadog Backend Listener: Stream Test Results to Datadog in CI/CD
In this blog post, we will see how to configure the JMeter Datadog Backend Listener to stream real-time test metrics into Datadog, wire it up inside a CI/CD pipeline, and build a feedback loop where a failing p95 can actually block a deployment.
If you have ever run a JMeter test in CI and stared at a flat .jtl file after the fact trying to figure out when things started going wrong, this is the workflow you have been missing.
AEO Quick Answer: How do you stream JMeter test results to Datadog in a CI/CD pipeline? First, download the Datadog Backend Listener JAR and place it in the
lib/extdirectory of your JMeter installation. Next, add a Backend Listener element to your Test Plan and selectorg.datadog.jmeter.plugins.DatadogBackendClientas the implementation. Then inject your API key at runtime using-Japikey=${DD_API_KEY}and run JMeter in non-GUI mode with the-nflag. Metrics stream to Datadog in real time under thejmeter.*namespace, tagged with a uniquetest_run_idper run.
What Is the JMeter Backend Listener?
JMeter ships with a Backend Listener config element that lets you forward sampler results to an external backend in real time during the test run. It implements the AbstractBackendListenerClient interface, which means third-party plugins can hook into the same mechanism.
Out of the box, JMeter includes two implementations:
GraphiteBackendListenerClient(available since JMeter 2.13)InfluxDBBackendListenerClient(available since JMeter 3.2)
The Datadog plugin adds a third: org.datadog.jmeter.plugins.DatadogBackendClient.
What makes this powerful is that results do not wait for the test to finish. Every batch of samples gets forwarded while the test is running, which means you can watch p95 climb in a Datadog dashboard in real time and kill the run before it ruins a shared staging environment.
Why Datadog Over InfluxDB + Grafana?
Both are valid approaches. Here is when Datadog wins:
- Your team already uses Datadog for APM, logs, and infrastructure monitoring. JMeter metrics live in the same place as your service metrics.
- You want to overlay load test results with, say, database query duration or JVM heap usage without exporting data anywhere.
- You need monitors and alerts on test metrics with zero additional infrastructure to spin up.
- Your CI/CD already stores a
DD_API_KEYsecret.
If your stack is 100% self-hosted and cost is a hard constraint, InfluxDB + Grafana is still a solid choice. But if Datadog is already in the picture, adding the JMeter plugin is genuinely a five-minute setup.
Prerequisites
Before you start, make sure you have:
- Apache JMeter 5.6.3 or later installed locally (or available in your CI runner image)
- JMeter Plugins Manager installed (
lib/ext/jmeter-plugins-manager-*.jar) - A Datadog account with an API key
- Your JMeter test plan (
.jmx) committed to source control
No Datadog Agent is required. The plugin sends metrics directly to the Datadog HTTP API.
Installing the Datadog Backend Listener Plugin
You have two options: manual install or Plugins Manager. Both drop the same JAR into lib/ext.
Option 1: JMeter Plugins Manager (Recommended for Local Dev)
- Open JMeter.
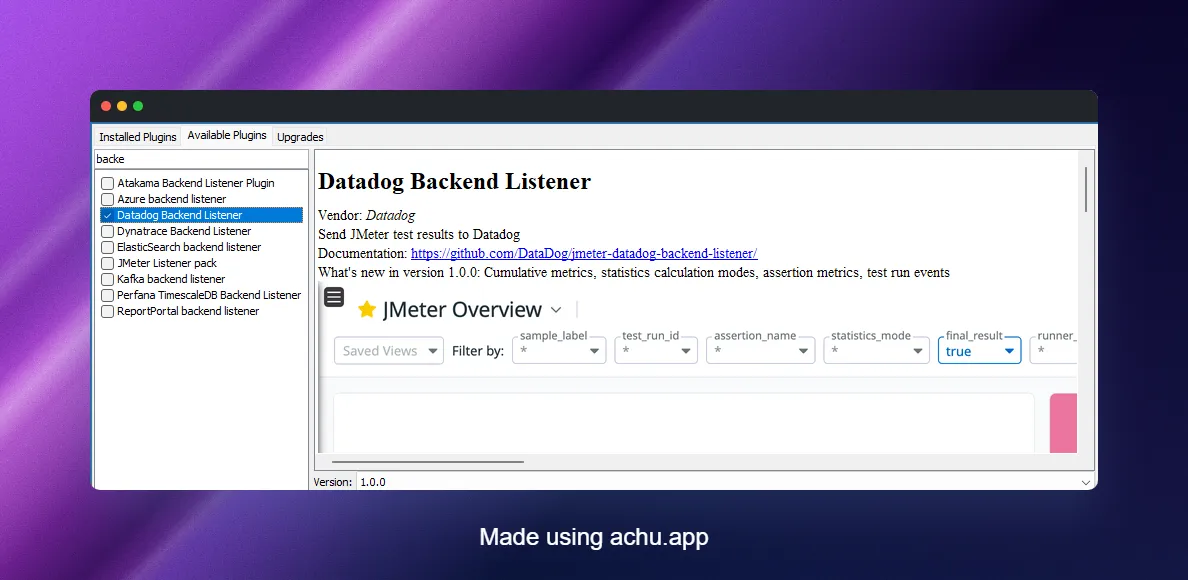
- Head to Options > Plugins Manager > Available Plugins.
- Search for Datadog Backend Listener.
- Check the box and click Apply Changes and Restart JMeter.
As shown below, the plugin appears in the Available Plugins tab of the Plugins Manager after JMeter restarts.
Option 2: Manual JAR Install (Required for CI)
In a CI environment, JMeter runs headless and there is no Plugins Manager UI to click through. Download the JAR directly from the GitHub releases page and bake it into your runner image or pipeline step.
# Download latest JAR from releasescurl -L \ https://github.com/DataDog/jmeter-datadog-backend-listener/releases/latest/download/jmeter-datadog-backend-listener-1.0.1-jar-with-dependencies.jar \ -o $JMETER_HOME/lib/ext/jmeter-datadog-backend-listener.jarReplace 1.0.1 with whatever version is current on the releases page. Check the Maven Central artifact ID com.datadoghq:jmeter-datadog-backend-listener for the latest stable release.
Configuring the Plugin in Your Test Plan
Once the JAR is in lib/ext, add the Backend Listener to your test plan:
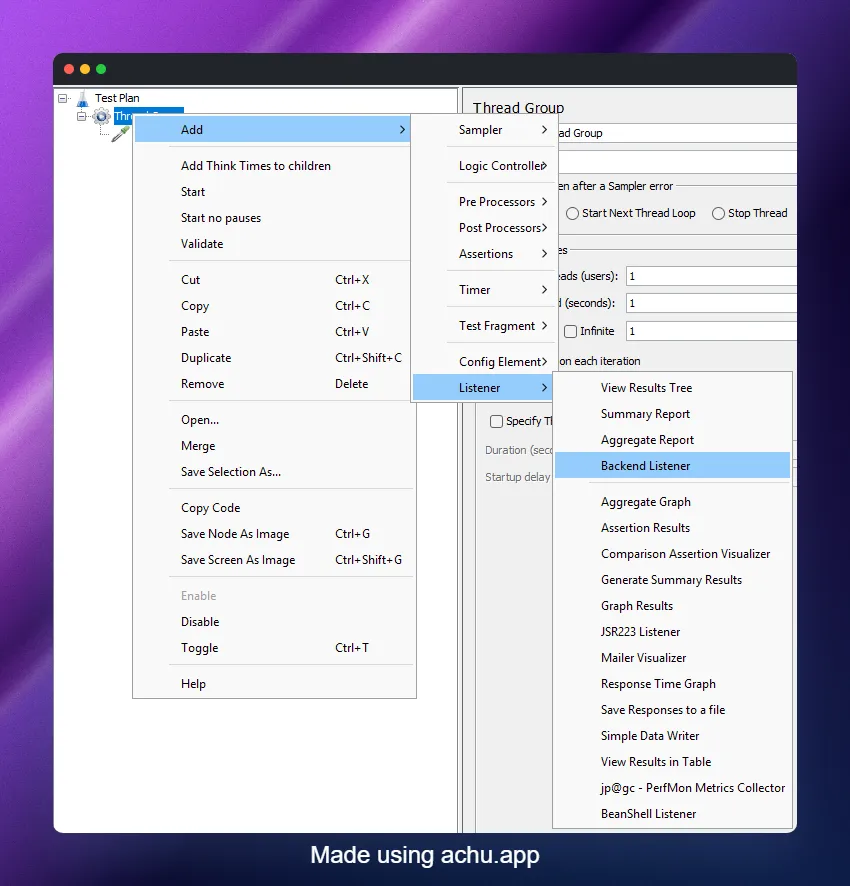
- Right-click on your Thread Group (or the Test Plan root for global coverage).
- Go to Add > Listener > Backend Listener.
- In the Backend Listener Implementation dropdown, select
org.datadog.jmeter.plugins.DatadogBackendClient. - Set
apiKeyto your Datadog API key. - Run your test and head to your Datadog account to confirm metrics are flowing.
As shown below, the Backend Listener configuration panel shows the apiKey field at the top, followed by the optional parameters.
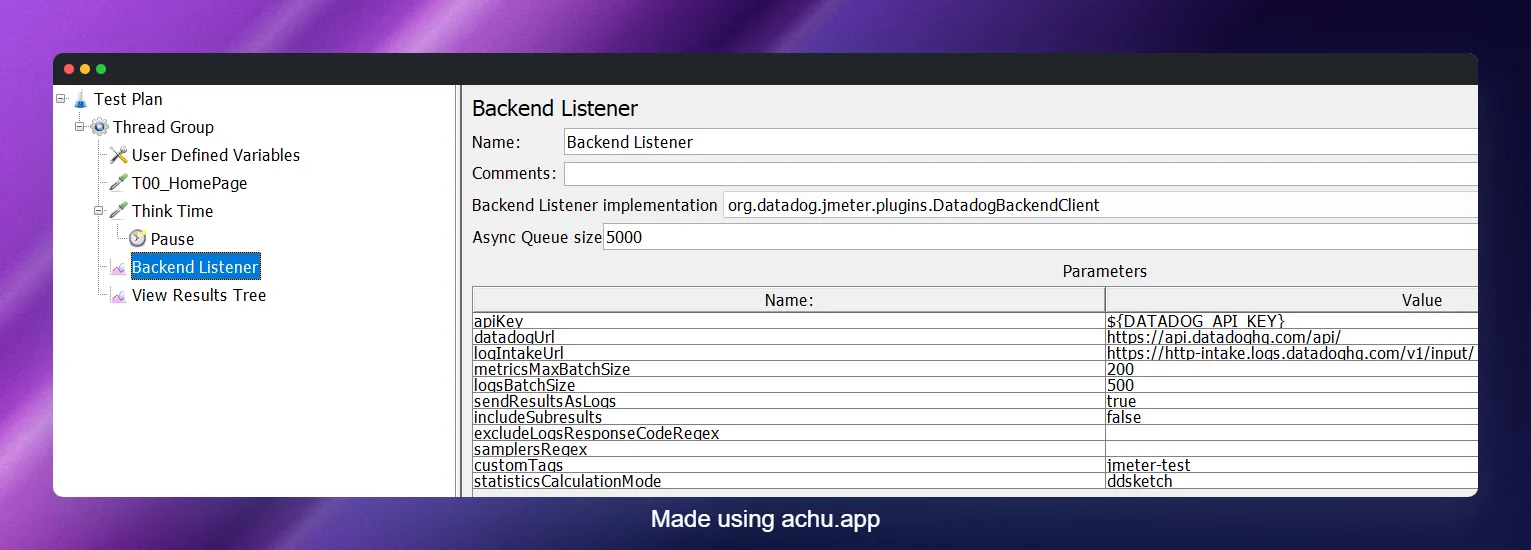
A note on placement: adding the listener at the Test Plan level captures all thread groups. Adding it at the Thread Group level scopes it to that group only. For most CI scenarios, Test Plan level is what you want.
Configuration Reference
The plugin supports the following parameters. All except apiKey are optional.
| Parameter | Default | What It Does |
|---|---|---|
apiKey | (required) | Your Datadog API key |
datadogUrl | https://api.datadoghq.com/api/ | Change to https://api.datadoghq.eu/api/ for EU accounts |
logIntakeUrl | https://http-intake.logs.datadoghq.com/v1/input/ | EU: https://http-intake.logs.datadoghq.eu/v1/input/ |
metricsMaxBatchSize | 200 | Metrics are submitted every 10 seconds in batches of this size |
logsBatchSize | 500 | Logs are submitted when this batch size is reached |
sendResultsAsLogs | true | Send individual sample results as Datadog log events |
includeSubresults | false | Include sub-results such as redirect hops |
excludeLogsResponseCodeRegex | "" | Regex to suppress certain response codes from logs, e.g. [123][0-5][0-9] to send only errors |
samplersRegex | "" | Regex to filter which samplers report metrics. Empty means all |
customTags | "" | Comma-separated tags added to every metric, e.g. env:staging,service:checkout |
statisticsCalculationMode | ddsketch | Algorithm for percentile calculation: ddsketch, aggregate_report, or dashboard |
The statisticsCalculationMode choice matters more than it looks. ddsketch is the default and uses Datadog’s own approximate percentile algorithm with a 1% relative error bound. If you want your Datadog p95 to match exactly what JMeter’s Aggregate Report listener shows in the GUI, use aggregate_report instead. Be aware that aggregate_report stores all response times in memory, which becomes a concern on long soak tests.
Understanding the Metrics Sent to Datadog
The plugin ships metrics with the jmeter.* namespace. Key ones to know:
Response time metrics (per sampler, tagged by sample_label):
jmeter.response_time.avgjmeter.response_time.p50,p75,p90,p95,p99jmeter.response_time.min,jmeter.response_time.max
Throughput and concurrency:
jmeter.responses.count- total sample countjmeter.responses.error_count- error countjmeter.responses.error_percent- error ratejmeter.active_threads.avg,min,max
Payload metrics:
jmeter.bytes_received.avgjmeter.bytes_sent.avg
Assertion metrics:
jmeter.assertions.countjmeter.assertions.failedjmeter.assertions.error
Final result metrics (emitted once at test end):
jmeter.final_result.response_time.*jmeter.final_result.responses.error_percentjmeter.final_result.throughput.rps
The jmeter.final_result.* metrics are particularly useful in CI contexts. Because they are emitted exactly once at test completion, you can query them for a clean, unambiguous snapshot of the run without needing to aggregate over a time window.
The plugin also emits Datadog Events at test start and test end, which appear in the Event Explorer. This is useful for marking exactly when a load test ran on your infrastructure dashboards.
Tagging Strategy: The Key to Isolating Test Runs
Every metric automatically gets a test_run_id tag in the format {timestamp}-{hostname}-{random8chars}, for example 2026-01-24T14:30:25Z-ci-runner-01-a1b2c3d4.
In distributed mode, the hostname portion becomes the JMeter runner_id. In local/CI mode, use runner_host or runner_mode:local to filter instead of relying on runner_id.
You can override test_run_id or add your own tags via customTags. In CI, tie the tag to your build number so you can trace any Datadog anomaly back to a specific commit:
# jmeter.properties or passed as -J flagscustomTags=env:staging,service:checkout-api,build_id:${BUILD_NUMBER},branch:${BRANCH_NAME}This makes Datadog queries scoped to a single test run trivial:
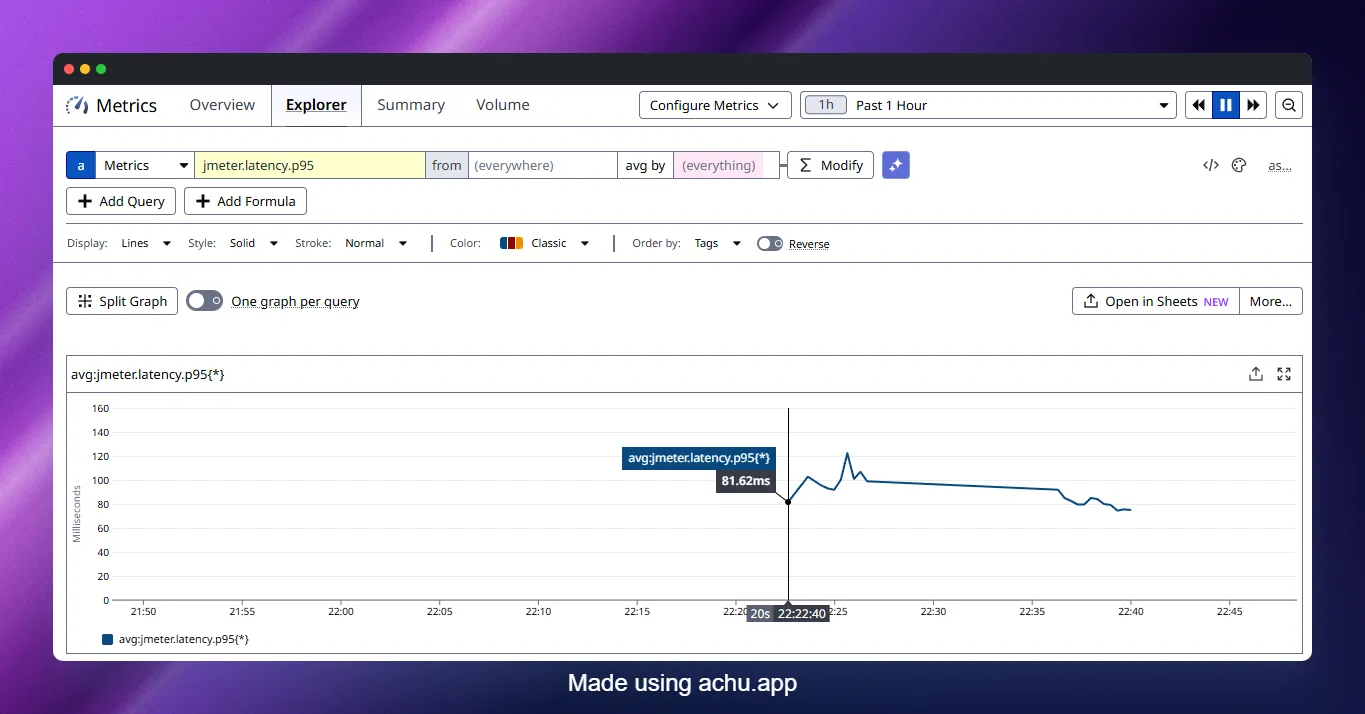
avg:jmeter.response_time.p95{env:staging,build_id:1234}Running Headless with JMeter Properties
In CI you always run JMeter in non-GUI mode. The Backend Listener configuration values embedded in the .jmx file are the defaults, but you can override them at runtime using JMeter properties.
A typical pattern is to keep the apiKey out of the .jmx entirely (never commit secrets to SCM) and inject it via a JMeter property:
jmeter -n \ -t tests/load-test.jmx \ -l results/results.jtl \ -e -o results/dashboard \ -Japikey=${DD_API_KEY} \ -Jcustom_tags="env:staging,build_id:${CI_BUILD_ID}" \ -Jthreads=100 \ -Jduration=300In the .jmx, reference the property in the Backend Listener:
<BackendListener guiclass="BackendListenerGui" testclass="BackendListener"> <elementProp name="arguments" elementType="Arguments"> <collectionProp name="Arguments.arguments"> <elementProp name="apiKey" elementType="Argument"> <stringProp name="Argument.name">apiKey</stringProp> <stringProp name="Argument.value">${__P(apikey,)}</stringProp> </elementProp> <elementProp name="customTags" elementType="Argument"> <stringProp name="Argument.name">customTags</stringProp> <stringProp name="Argument.value">${__P(custom_tags,env:local)}</stringProp> </elementProp> </collectionProp> </elementProp> <stringProp name="classname">org.datadog.jmeter.plugins.DatadogBackendClient</stringProp></BackendListener>The ${__P(property_name,default_value)} function reads a JMeter property at runtime and falls back to the default if it is not set. This keeps your test plan portable across local development and CI without any hardcoded secrets.
CI/CD Integration: GitHub Actions
Here is a complete GitHub Actions workflow that runs a JMeter test, streams metrics to Datadog, and fails the pipeline if the error rate crosses a threshold.
name: Performance Gate
on:  pull_request:    branches: [main]  schedule:    - cron: '0 2 * * *'  # Nightly soak
jobs:  load-test:    runs-on: ubuntu-latest
    env:      JMETER_VERSION: 5.6.3      JMETER_HOME: /opt/jmeter
    steps:      - uses: actions/checkout@v4
      - name: Install JMeter        run: |          wget -q https://archive.apache.org/dist/jmeter/binaries/apache-jmeter-${JMETER_VERSION}.tgz          tar -xzf apache-jmeter-${JMETER_VERSION}.tgz -C /opt/          mv /opt/apache-jmeter-${JMETER_VERSION} ${JMETER_HOME}
      - name: Install Datadog Backend Listener        run: |          curl -L \            https://github.com/DataDog/jmeter-datadog-backend-listener/releases/latest/download/jmeter-datadog-backend-listener-1.0.1-jar-with-dependencies.jar \            -o ${JMETER_HOME}/lib/ext/jmeter-datadog-backend-listener.jar
      - name: Run JMeter Load Test        run: |          ${JMETER_HOME}/bin/jmeter -n \            -t tests/load-test.jmx \            -l results/results.jtl \            -e -o results/dashboard \            -Japikey=${{ secrets.DD_API_KEY }} \            -Jcustom_tags="env:staging,build_id:${{ github.run_id }},branch:${{ github.ref_name }}" \            -Jthreads=100 \            -Jduration=300 \            -Jbase_url=${{ vars.STAGING_URL }}
      - name: Check SLA Thresholds        run: |          python3 scripts/check_jtl.py results/results.jtl \            --max-error-rate 1.0 \            --max-p95 500
      - name: Upload Results        uses: actions/upload-artifact@v4        if: always()        with:          name: jmeter-results-${{ github.run_id }}          path: |            results/results.jtl            results/dashboard
A few things worth calling out in this workflow:
- The
DD_API_KEYis stored in GitHub Secrets, never in the YAML file. build_iduses${{ github.run_id }}so every run is uniquely tagged in Datadog.- The
check_jtl.pyscript parses the.jtllocally to enforce a hard CI gate, independent of Datadog. Datadog gives you visibility; the.jtlassertion gives you the pipeline pass/fail. Both serve different purposes.
CI/CD Integration: GitLab CI
performance-test: stage: performance image: justb4/jmeter:5.6.3 before_script: - mkdir -p /opt/jmeter/lib/ext - curl -L https://github.com/DataDog/jmeter-datadog-backend-listener/releases/latest/download/jmeter-datadog-backend-listener-1.0.1-jar-with-dependencies.jar -o /opt/jmeter/lib/ext/jmeter-datadog-backend-listener.jar script: - jmeter -n -t tests/load-test.jmx -l results/results.jtl -Japikey=${DD_API_KEY} -Jcustom_tags="env:staging,build_id:${CI_PIPELINE_ID},branch:${CI_COMMIT_REF_NAME}" -Jthreads=${VUS:-100} -Jduration=${DURATION:-300} variables: VUS: "100" DURATION: "300" artifacts: paths: - results/ when: always only: - main - /^release\/.*/Store DD_API_KEY as a protected CI/CD variable in GitLab. The justb4/jmeter Docker image is a community-maintained JMeter image that works well as a base; swap for your own hardened image if your security policies require it.
CI/CD Integration: Jenkins
pipeline {    agent any
    environment {        JMETER_HOME = '/opt/jmeter'        DD_API_KEY  = credentials('datadog-api-key')    }
    stages {        stage('Performance Test') {            steps {                sh '''                    ${JMETER_HOME}/bin/jmeter -n \                        -t tests/load-test.jmx \                        -l results/results.jtl \                        -e -o results/dashboard \                        -Japikey=${DD_API_KEY} \                        -Jcustom_tags="env:staging,build_id:${BUILD_NUMBER},job:${JOB_NAME}" \                        -Jthreads=100 \                        -Jduration=300                '''            }        }    }
    post {        always {            archiveArtifacts artifacts: 'results/**', fingerprint: true            perfReport 'results/results.jtl'        }        failure {            slackSend channel: '#perf-alerts',                      message: "Performance test FAILED for build ${BUILD_NUMBER}. Check Datadog dashboard."        }    }}
The credentials('datadog-api-key') binding pulls the API key from Jenkins Credentials Manager. The perfReport step uses the Performance Plugin to generate a trend chart inside Jenkins, while Datadog handles the live streaming view.
Using the Out-of-the-Box Datadog Dashboard
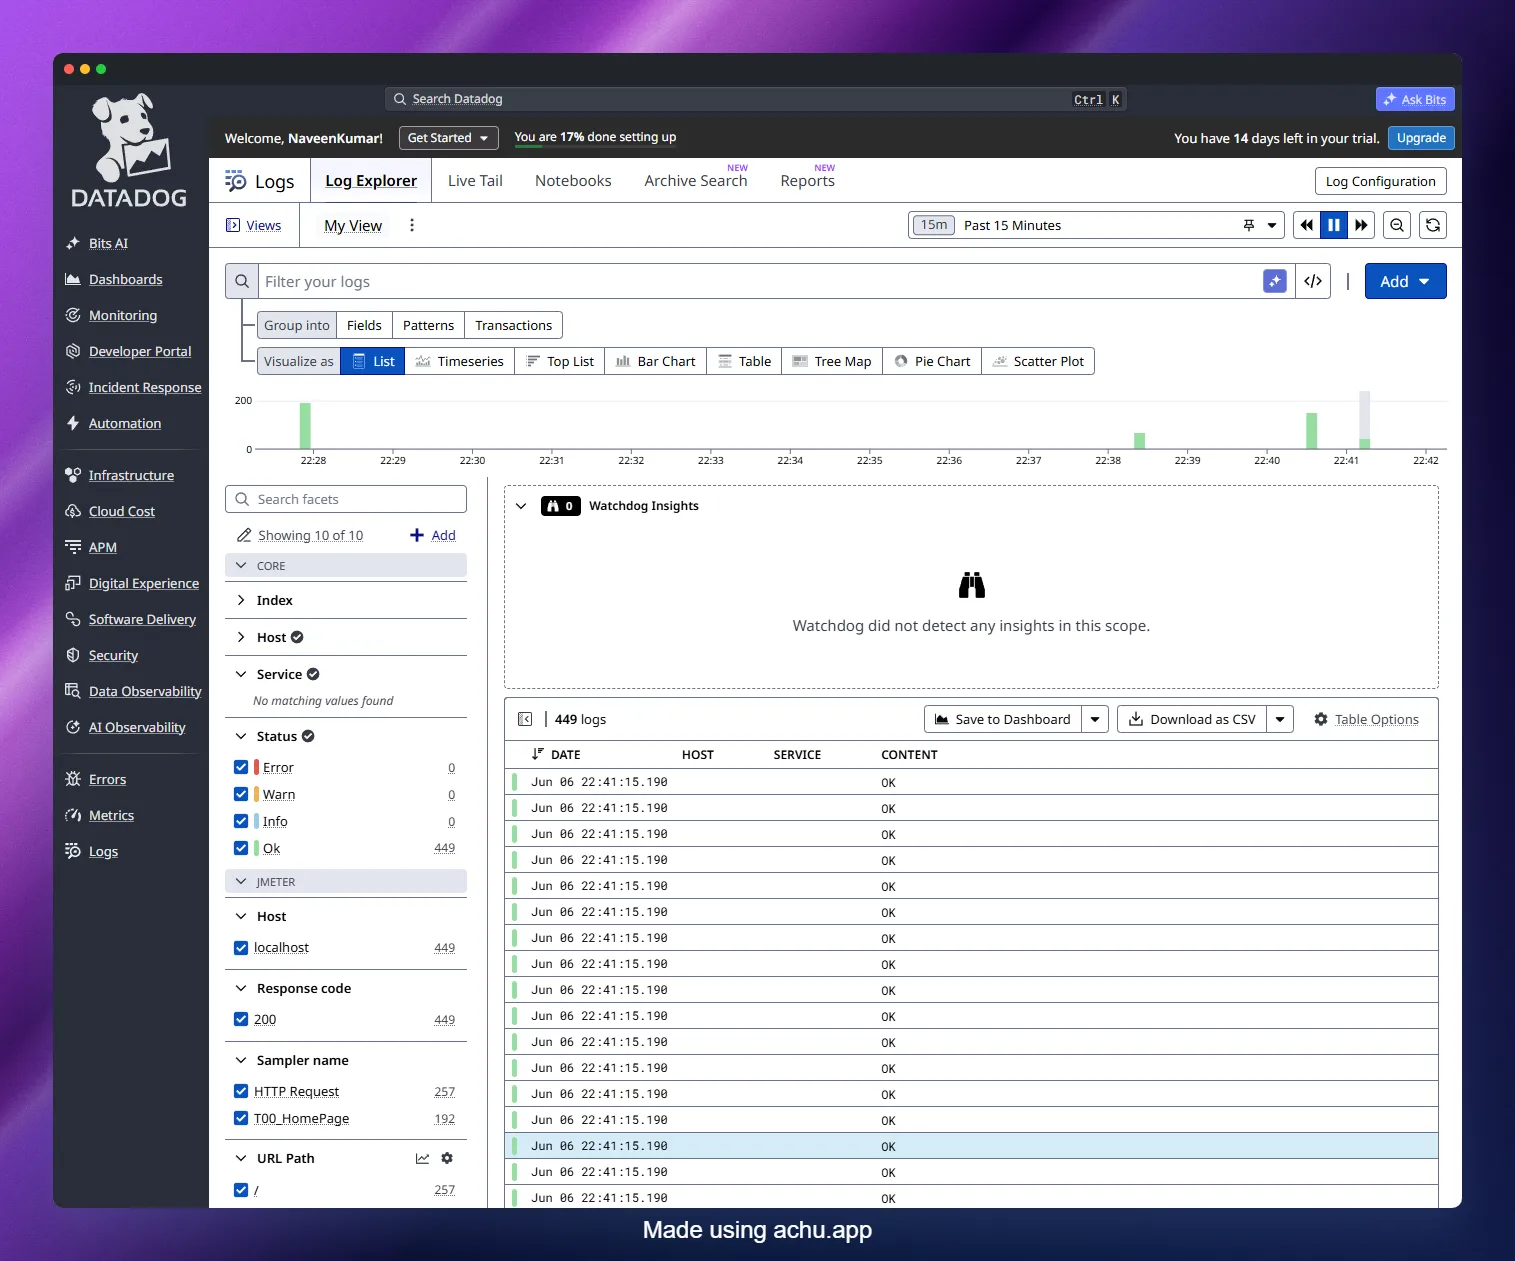
Once your first test run completes and metrics are flowing, Datadog gives you a pre-built JMeter Overview Dashboard automatically. Head to Dashboards > Dashboard List and search for JMeter.
The dashboard includes:
- Active virtual users over time
- Requests per second
- Error rate (%)
- Response time percentiles (p50, p90, p95, p99) per sampler
- Bytes received and sent
You can clone this dashboard and add panels from your application’s APM metrics alongside it. The moment you do that, you stop looking at load test results in isolation and start seeing how your service actually responds to load.
Querying Final Results in Datadog Notebooks
For post-test reporting, jmeter.final_result.* metrics are the cleanest source of truth. They are emitted exactly once at test end. Use statisticsCalculationMode=aggregate_report if you want these to match JMeter’s own Aggregate Report values.
Example Datadog Notebook queries to include in a test report:
# p95 response time for all samplers in a specific runavg:jmeter.final_result.response_time.p95{sample_label:total,test_run_id:YOUR_RUN_ID}
# Error rateavg:jmeter.final_result.responses.error_percent{sample_label:total,test_run_id:YOUR_RUN_ID}
# Throughput (requests per second)avg:jmeter.final_result.throughput.rps{sample_label:total,test_run_id:YOUR_RUN_ID}
Replace YOUR_RUN_ID with the actual test_run_id tag value from the run. If you injected build_id via customTags, filter by that instead for a more human-readable query:
avg:jmeter.final_result.response_time.p95{env:staging,build_id:1234}Because these metrics are only emitted once, make sure your selected time range in the Notebook includes the test completion timestamp.
Correlating with APM Data
This is where the Datadog integration earns its keep over a standalone InfluxDB setup.
The workflow I personally follow for API or microservice performance validation:
- Add a custom header to every JMeter request so you can isolate test traffic in APM:
<!-- HTTP Header Manager at Test Plan level --><HeaderManager> <collectionProp name="HeaderManager.headers"> <elementProp name="X-Load-Test-Run" elementType="Header"> <stringProp name="Header.name">X-Load-Test-Run</stringProp> <stringProp name="Header.value">${__P(build_id,manual)}</stringProp> </elementProp> </collectionProp></HeaderManager>In Datadog APM, filter traces by the custom header value using a facet or by adding it to your trace tags.
On the same dashboard, plot:
jmeter.response_time.p95(client-side, what JMeter measured)trace.servlet.request.duration.p95or equivalent APM metric (server-side, what your app reported)
The gap between these two values tells you where latency is being added: network, JMeter overhead, or the application itself.
- Drop a Datadog Event annotation on the chart using the test start/end events the plugin emits automatically. This gives you a clear visual marker of the test window on every infrastructure graph you overlay.
Troubleshooting
No metrics appearing in Datadog: Check $JMETER_HOME/bin/jmeter.log. The plugin logs HTTP errors from the API calls there. Common causes are an invalid API key, a network firewall blocking outbound HTTPS to api.datadoghq.com, or the JAR not being placed in lib/ext (not lib/).
runner_id tag is empty: The runner_id tag is only populated in distributed JMeter mode where JMeter sets a distributed prefix. In local and single-node CI runs, use runner_host or add your own custom_tags to identify the runner.
p95 values in Datadog do not match the Aggregate Report: Change statisticsCalculationMode to aggregate_report. The default ddsketch mode uses a different (approximate) algorithm and will diverge from JMeter’s exact values, especially at sparse data points.
Log volume is exploding: Set sendResultsAsLogs=false to stop forwarding individual sample results as log events. This is the biggest driver of log volume. Alternatively, use excludeLogsResponseCodeRegex=[123][0-5][0-9] to send only error responses as logs.
EU Datadog account users: Override both datadogUrl to https://api.datadoghq.eu/api/ and logIntakeUrl to https://http-intake.logs.datadoghq.eu/v1/input/. Missing either one means either metrics or logs (not both) will fail to land.
Pitfalls to Avoid
A few things that trip people up when setting this up in a real pipeline:
Committing
apiKeyinto the JMX. Always use${__P(apikey,)}and inject it at runtime. A hardcoded API key in a.jmxfile committed to GitHub is a security incident waiting to happen.Placing the JAR in
lib/instead oflib/ext/. JMeter only loads Backend Listener implementations fromlib/ext. A JAR in the wrong directory will result in a silent failure where the class simply is not found.Not tagging with
build_idor equivalent. Without a unique tag per run, your Datadog queries return blended data across all runs. Filtering bytest_run_idalone works but is awkward; a human-readablebuild_idtag makes notebook queries and alert conditions far easier to write.Adding the Backend Listener inside a loop. JMeter will register and run the listener for every iteration. Place it at the Thread Group or Test Plan level, not inside a Loop Controller.
Using GUI mode for actual load runs in CI. Always
-n(non-GUI) in CI. GUI mode consumes JMeter’s own resources and skews the results you are trying to measure.
Wrapping Up
The JMeter Datadog Backend Listener removes the biggest frustration with JMeter in CI: the wait. You no longer need to finish a test, download a .jtl, open JMeter’s dashboard generator, and then try to correlate what you see with what your application was doing at the time. Metrics stream in real time, the plugin emits start/end events automatically, and you can build monitors that alert your team the moment p95 crosses a threshold mid-test.
The practical steps are:
- Drop the JAR in
lib/ext - Add the Backend Listener to the Test Plan root
- Inject
apiKeyandcustomTagsat runtime via-Jflags - Use
test_run_idorbuild_idtags to isolate each CI run in Datadog - Query
jmeter.final_result.*for your post-test pass/fail gate
Happy Testing!