JMeter Dummy Sampler: How to Mock API Responses and Debug Test Plans Without a Server

JMeter Dummy Sampler: How to Mock API Responses and Debug Test Plans Without a Server
In this blog post, we will see how the JMeter Dummy Sampler plugin lets you build and debug a complete test plan before the application you are testing even exists. If you have ever waited on a test environment to come back up just so you could check whether a JSON Extractor regex was right, this plugin is for you.
The Dummy Sampler (plugin id jpgc-dummy) is one of the most downloaded plugins on jmeter-plugins.org, sitting right behind Custom Thread Groups, the Throughput Shaping Timer, and the basic graphs in the PerfAtlas download stats. Despite that, most people only use it as a placeholder sampler. It does a lot more than that, and I want to walk through the practical side of it with a working example.
1. What is the JMeter Dummy Sampler?
The Dummy Sampler is a sampler that does no network activity at all. Instead of sending a request, it produces a SampleResult with exactly the values you type into it: response code, response message, response body, request body, response time, latency, connect time, and even the URL.
The official description on the jmeter-plugins.org wiki puts it well: it is “the most obedient of the JMeter samplers”. It generates a sample with whatever you tell it to, every single time.
That sounds trivial, but it unlocks three things that are hard to do any other way:
- Debugging extractors and assertions offline. Paste a real response body into the sampler and iterate on your JSON Extractor, Regular Expression Extractor, or JSR223 PostProcessor without hitting the server.
- Building the test plan before the API exists. Shift-left performance testing usually stalls because there is nothing to hit. With the Dummy Sampler you can model the whole flow, including correlation between steps, and swap in real HTTP Request samplers later.
- Generating synthetic results. Because it honours response time, latency, and success flags, you can produce a realistic-looking
.jtlto validate listeners, Backend Listeners, dashboards, and CI thresholds.
2. Installing the Dummy Sampler plugin
The easiest way is through the Plugins Manager. If you do not have it yet, follow How to install JMeter Plugins Manager first. Then open Options > Plugins Manager > Available Plugins, search for “Dummy Sampler”, tick it, and click Apply Changes and Restart JMeter.
For headless or Docker setups, use PluginsManagerCMD instead:
# from the JMeter home directoryjava -cp lib/ext/jmeter-plugins-manager-1.10.jar \ org.jmeterplugins.repository.PluginManagerCMDInstallerbin/PluginsManagerCMD.sh install jpgc-dummyI covered that flow end to end in JMeter Plugin Install Automation with PluginsManagerCMD in a Docker Image.
The current release is 0.4, which ships a single jar, jmeter-plugins-dummy-0.4.jar, plus the shared jmeter-plugins-cmn-jmeter library. After the restart you will see two new elements:
| Element | Where it lives | Purpose |
|---|---|---|
jp@gc - Dummy Sampler | Add > Sampler | Emits a fake sample with the values you configure |
jp@gc - Add Dummy Subresult | Add > Post Processors | Attaches a fake sub-sample to the parent sample |
3. Every Dummy Sampler field, explained
Here is the configuration screen from JMeter 5.6.3 on my machine, set up to fake a POST /api/orders call:
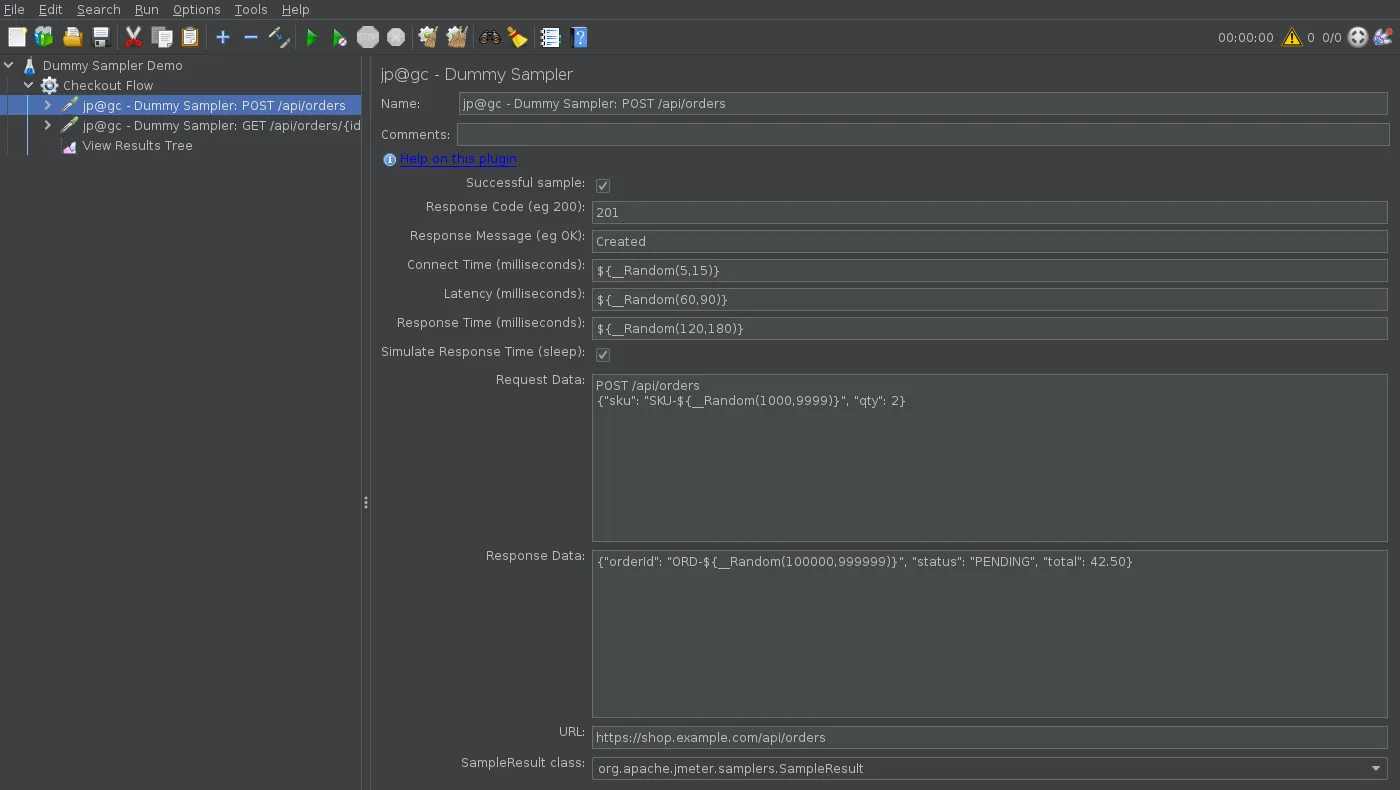
Every text field accepts JMeter functions and variables, which is what makes the plugin useful rather than a toy. Here is what each one does, taken from the plugin source (kg.apc.jmeter.dummy.DummyElement):
| Field | JMX property | Default | Notes |
|---|---|---|---|
| Successful sample | SUCCESFULL | checked | Boolean checkbox. Sets SampleResult.setSuccessful(). Assertions can still override it |
| Response Code | RESPONSE_CODE | 200 | Any string. Functions are evaluated |
| Response Message | RESPONSE_MESSAGE | OK | Shows in listeners and the JTL responseMessage column |
| Connect Time (ms) | CONNECT | ${__Random(1,5)} | Written to SampleResult.setConnectTime() |
| Latency (ms) | LATENCY | ${__Random(1,50)} | Written to SampleResult.setLatency() |
| Response Time (ms) | RESPONSE_TIME | ${__Random(50,500)} | Becomes the elapsed column |
| Simulate Response Time (sleep) | WAITING | checked | If checked the thread really sleeps for Response Time ms; if not, the time is stamped |
| Request Data | REQUEST_DATA | placeholder text | Shown under the Request tab in View Results Tree |
| Response Data | RESPONSE_DATA | placeholder text | The body your extractors and assertions run against |
| URL | URL | empty | Optional. Populates the URL column in the JTL |
| SampleResult class | RESULT_CLASS | org.apache.jmeter.samplers.SampleResult | Lets you emit HTTPSampleResult or another subclass |
Two details are worth calling out.
First, the misspelt property name SUCCESFULL (one S) is real. If you are generating JMX from a template or editing it by hand, spell it the way the plugin does or the checkbox will silently reset to unchecked.
Second, Simulate Response Time (sleep) is what separates “generate a fake result” from “behave like a slow server”. With it checked, the plugin calls sampleStart(), sleeps for the configured milliseconds, then sampleEnd(), so the thread is genuinely occupied. With it unchecked, the sampler returns instantly and just stamps the time onto the result. I will come back to why this matters for throughput in section 6.
4. A practical example: mocking a two-step order flow
Let me build something realistic. The flow is: create an order, capture its id, then fetch the order. In a real plan that is two HTTP Request samplers with a JSON Extractor in between. Here I will do it entirely with Dummy Samplers so the correlation logic can be tested with zero infrastructure.
4.1 Step one: POST /api/orders
Configure the first Dummy Sampler like this:
Successful sample: checkedResponse Code: 201Response Message: CreatedConnect Time: ${__Random(5,15)}Latency: ${__Random(60,90)}Response Time: ${__Random(120,180)}Simulate Response Time: checkedRequest Data: POST /api/orders {"sku": "SKU-${__Random(1000,9999)}", "qty": 2}Response Data: {"orderId": "ORD-${__Random(100000,999999)}", "status": "PENDING", "total": 42.50}URL: https://shop.example.com/api/ordersUnder it, add a JSON Extractor with:
Names of created variables: orderIdJSON Path expressions: $.orderIdMatch No.: 1Default Values: NOT_FOUNDand a JSON Assertion asserting $.status equals PENDING.
4.2 Step two: GET /api/orders/{id}
The second Dummy Sampler consumes ${orderId}:
Successful sample: checkedResponse Code: ${__jexl3(${__Random(1,100)} > 5 ? 200 : 503)}Response Message: OKConnect Time: 0Latency: ${__Random(20,40)}Response Time: ${__Random(40,80)}Simulate Response Time: checkedRequest Data: GET /api/orders/${orderId}Response Data: {"orderId": "${orderId}", "status": "CONFIRMED"}URL: https://shop.example.com/api/orders/${orderId}The __jexl3 expression in the Response Code field returns 200 roughly 95% of the time and 503 the other 5%. Add a Response Assertion on the Response Code field with pattern 200 and Equals mode so those 503s get flagged as failures.
4.3 The equivalent JMX
If you prefer to drop this straight into a .jmx, this is the first sampler as JMeter saves it:
<kg.apc.jmeter.samplers.DummySampler guiclass="kg.apc.jmeter.samplers.DummySamplerGui" testclass="kg.apc.jmeter.samplers.DummySampler" testname="POST /api/orders"> <boolProp name="WAITING">true</boolProp> <boolProp name="SUCCESFULL">true</boolProp> <stringProp name="RESPONSE_CODE">201</stringProp> <stringProp name="RESPONSE_MESSAGE">Created</stringProp> <stringProp name="REQUEST_DATA">POST /api/orders{"sku": "SKU-${__Random(1000,9999)}", "qty": 2}</stringProp> <stringProp name="RESPONSE_DATA">{"orderId": "ORD-${__Random(100000,999999)}", "status": "PENDING", "total": 42.50}</stringProp> <stringProp name="RESPONSE_TIME">${__Random(120,180)}</stringProp> <stringProp name="LATENCY">${__Random(60,90)}</stringProp> <stringProp name="CONNECT">${__Random(5,15)}</stringProp> <stringProp name="URL">https://shop.example.com/api/orders</stringProp> <stringProp name="RESULT_CLASS">org.apache.jmeter.samplers.SampleResult</stringProp></kg.apc.jmeter.samplers.DummySampler>4.4 Running it
I ran this with 5 threads, 1 second ramp-up, and 20 loops, first in the GUI to inspect it and then in non-GUI mode to get a report:
bin/jmeter -n -t dummy-sampler-demo.jmx -l results.jtl -e -o reportThe summariser output:
summary = 200 in 00:00:05 = 39.9/s Avg: 105 Min: 40 Max: 179 Err: 9 (4.50%)And the numbers from the HTML report’s statistics.json:
| Label | Samples | Errors | Avg (ms) | Min | Max | 90th pct | Throughput/s |
|---|---|---|---|---|---|---|---|
POST /api/orders | 100 | 0 | 152 | 120 | 179 | 174 | 20.3 |
GET /api/orders/{id} | 100 | 9 | 58 | 40 | 81 | 76 | 20.7 |
| Total | 200 | 9 | 105 | 40 | 179 | 171 | 40.1 |
Every one of those numbers came from my configuration, not from a server. The 4.5% error rate is the __jexl3 coin flip, the 120 to 179 ms range on the POST is the __Random(120,180), and the throughput is simply 5 threads divided by the sum of the sleep times.
In View Results Tree, you can confirm the correlation worked. The GET sample below shows the orderId extracted from the previous POST response flowing into the response body and URL of the next request:
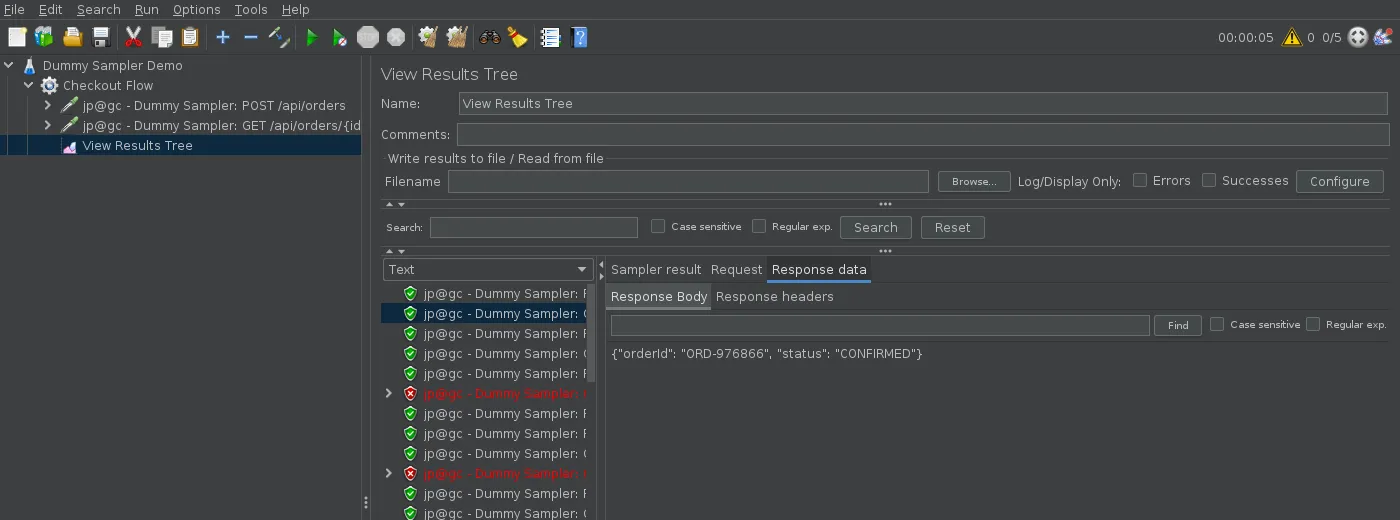
The red entries in the tree are the simulated 503s failing the Response Assertion, exactly as they would against a flaky real service.
5. Debugging extractors with real response bodies
This is the use case I reach for most often. When a Regular Expression Extractor is not matching and the server round trip takes 3 seconds plus a login, the feedback loop is painful.
The workflow:
- Run the real request once and copy the response body from View Results Tree.
- Add a Dummy Sampler next to the real sampler and paste that body into Response Data.
- Untick Simulate Response Time (sleep) so it returns instantly.
- Move your extractor under the Dummy Sampler and add a Debug Sampler after it.
- Disable the real sampler, run the thread group with 1 thread and 1 loop, and check the Debug Sampler output.
Each iteration now takes milliseconds. Once the extractor works, drag it back under the real sampler and disable (do not delete) the Dummy Sampler so it is there next time.
For JSON, the same trick works with the JSON Extractor and JSON JMESPath Extractor. The Response Data field stores the text exactly as pasted, including line endings, so a multi-line regex behaves the same as it would against the live response.
One thing the Dummy Sampler does not fake is response headers. SampleResult.setResponseHeaders() is never called, so a Regular Expression Extractor with Field to check: Response Headers will find nothing. If you need to test header extraction, put the header text into Response Data temporarily and switch the field to Body.
6. Generating realistic load data for dashboards and CI gates
Because the Dummy Sampler writes proper elapsed, Latency, Connect, responseCode, and success values, listeners cannot tell the difference. That makes it ideal for validating everything downstream of the sampler:
- A Backend Listener pointed at InfluxDB or Prometheus, as described in Real-Time JMeter Metrics with Prometheus and Grafana. You can build and tune Grafana panels against a stable, repeatable stream of fake data before the real test runs.
- CI thresholds such as the JMeter Maven plugin’s error-percentage gate or a
Tauruspass/fail criterion. Set the__jexl3failure rate to 6% and confirm your 5% gate actually fails the build. - Throughput Shaping Timer schedules. Since a Dummy Sampler with sleep enabled behaves like a server with a fixed response time, you can check whether your thread count can actually reach the target RPS. If you set 50 threads with a 200 ms sleep, the ceiling is 250 RPS, no matter what the timer asks for. See Throughput Shaping Timer vs Concurrency Thread Group for why that ceiling matters.
Here is the mental model for that last point. With Simulate Response Time checked:
max RPS per thread = 1000 / (response time in ms)max RPS overall = threads * 1000 / response timeWith it unchecked, a single thread can produce thousands of samples per second, which is great for stress-testing a listener or a JTL writer but useless for anything timing related.
7. The Add Dummy Subresult post-processor
The second element the plugin installs is jp@gc - Add Dummy Subresult. It is a PostProcessor that takes the same fields as the sampler and, when it runs, calls addSubResult() on the parent sample.
The use case from the official docs is simulating an HTTP Request with embedded resources: one parent Dummy Sampler for the HTML page, then three or four Dummy Subresult post-processors under it for CSS, JS, and image calls. In View Results Tree the parent becomes expandable, exactly like a real page with Retrieve All Embedded Resources ticked.
This is handy when you are writing a custom listener or a JSR223 script that walks prev.getSubResults(), and you want to test it without a real page load.
8. Common pitfalls
A few things I have tripped over or seen others trip over:
- Putting a function in the Successful checkbox. It is a checkbox, so you cannot. To simulate intermittent failures, randomise the Response Code as shown above and let a Response Assertion decide, or use an If Controller with two Dummy Samplers.
- Forgetting to untick Simulate Response Time when debugging. The default is checked with
${__Random(50,500)}, so your “instant” debug loop is quietly adding up to half a second per sample. - Expecting Sent bytes or headers. The plugin never sets
sentBytesor response headers. Size in bytes is calculated from the Response Data you provide, so byte-based assertions work, but header-based ones do not. - Leaving Dummy Samplers enabled in the real test. They inflate your sample counts and throughput. Disable them, or keep them in a separate Test Fragment that only a debug thread group references.
- Assuming the URL field validates. It is parsed with
java.net.URL, and if parsing fails the plugin only logs at debug level and leaves the URL blank. If your JTL’s URL column is empty, check for a missing scheme.
9. Dummy Sampler vs Debug Sampler vs HTTP Mirror Server
People often ask which of these to use, so here is a quick comparison:
| Need | Use |
|---|---|
| Fake a response body to test extractors/assertions | Dummy Sampler |
| Print current variables and properties | Debug Sampler (built in) |
| Echo a real HTTP request back to see what was sent | HTTP Mirror Server (built in, port 8081) |
| Fake timings for listeners, dashboards, CI thresholds | Dummy Sampler with Simulate Response Time |
| Simulate a page with embedded resources | Dummy Sampler + Add Dummy Subresult |
My debugging thread group usually contains a Dummy Sampler, the extractor under test, and a Debug Sampler right after it.
Conclusion
The Dummy Sampler is small, has not needed a release since version 0.4, and still earns its place near the top of the download charts because it solves a problem every performance engineer has: the test plan needs work but the environment is not available. Paste in a response, wire up your extractors, get the correlation right, and validate your reporting pipeline, all without a single network call.
The main takeaway: treat the Dummy Sampler as a first-class part of your workflow, not a placeholder. Keep one in every test plan, disabled, with the last known good response body pasted in. The next time an extractor breaks at 2 AM, you will fix it in seconds instead of waiting on a server.